The Complex Landscape of Tumors: A Call for Advanced Spatial Omics Tools
Tumors are far from simple accumulations of cancer cells. Instead, they are intricate ecosystems teeming with various cellular subtypes. The spatial organization of these cells within tumors offers a window into the molecular intricacies of cancer, influencing tumor progression and response to treatments. Traditional methods, like multiplexed immunofluorescence, can only probe so deep. The emerging realm of spatial omics technologies promises to bridge this gap. Among these, the NanoString GeoMx® Digital Spatial Profiling (DSP) and 10x Genomics Visium platforms are turning heads, empowering researchers to gain a comprehensive understanding of tumor heterogeneity.
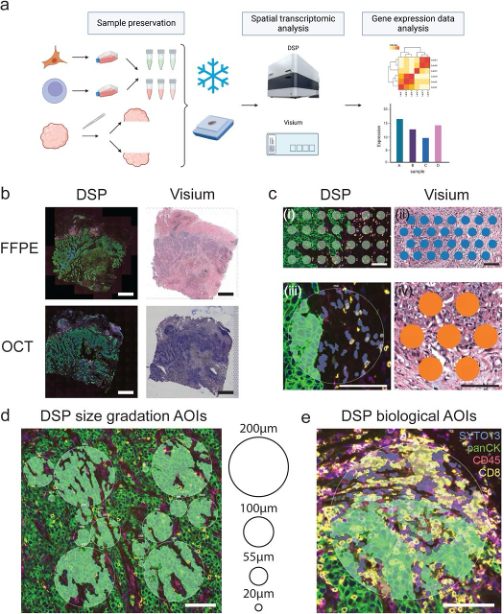
For a rigorous comparison between DSP and Visium, the researchers devised an intricate experimental setup, using four primary breast cancer tissue samples and two cultured cell lines (Figure 1). This approach ensured a detailed exploration of the diverse cellular interactions characteristic of tumors.
Figure 1: Experiment overview. (a) Schematic illustration of sample preservation and experiment workflow. Cultured Jurkat and SKBR3 cells were mixed at six different ratios and preserved as OCT or FFPE samples. Tissue samples were sliced in the middle and the resulting two pieces were preserved as OCT or FFPE samples respectively. Closest possible sections were used for DSP and Visium assays. The illustration was created with BioRender.com. (b) Example images of tissue morphology. FFPE and OCT sections from sample 4806 were processed for DSP or Visium assays. Note the overall matching morphology between FFPE and OCT samples and between sections used for DSP and Visium assays. Scale bars = 1mm. (c) Example of DSP AOIs and Visium spots used for direct comparison. (i) Example of Visium mimic AOIs across the tumour-stroma interface. (ii) Example of Visium spots across the tumour-stroma interface used for direct DSP and Visium comparison. (iii) Example of segmented comparison DSP AOIs. Each AOI was segmented into pan-cytokeratin positive and pan-cytokeratin negative segments according to the immunofluorescence signal. (iv) Example of Visium spots located in the matching region where segmented comparison DSP AOIs were collected. Scale bars = 100μm. (d) Example of size gradation and biological DSP AOIs to test the performance of segmentation of the DSP platform. Scale bars = 100μm.
Key Observations
Gene Expression Correlation: High correlation was observed in controlled cell array samples between the two platforms. However, the complex nature of breast cancer tissues revealed nuanced differences in their gene detection capabilities.
Diving Deep into Tissue Analysis: While both platforms displayed an impressive depth in tissue analysis, Visium on OCT processed samples lagged slightly in gene detection compared to its FFPE counterpart. The nuances in tissue preparation significantly impact the outcomes.
Spotlight on Platform Strengths
Visium by 10x Genomics: With its unbiased approach, Visium offers a comprehensive landscape of entire tissues. This bird's-eye view allows researchers to unearth spatial heterogeneity in unmatched detail. Visium excels in initial exploratory research phases, offering whole transcriptomes across expansive tissue areas.
NanoString GeoMx DSP: DSP, on the other hand, excels in precision. Its unique ability to deep-dive into specific regions of interest, focusing on intricate molecular profiling, makes it an invaluable tool for hypothesis-driven research.
Exploring Specific Regions with DSP
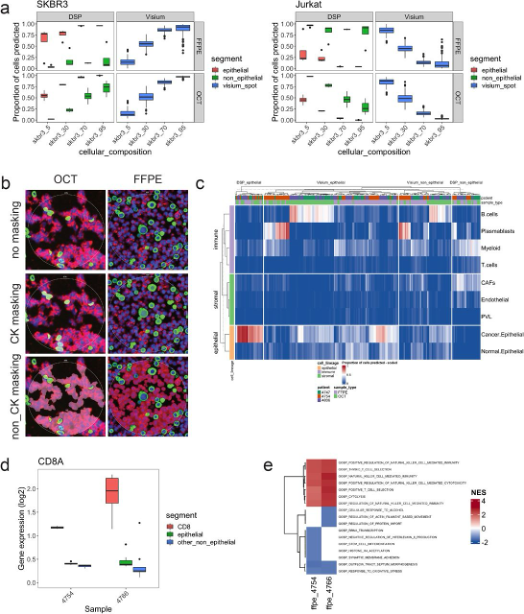
The DSP platform's prowess was further showcased when zooming into granular regions. This deep dive revealed the intricate interplay between closely associated cell types like CD8 T cells and surrounding cells (Figure 2). However, ensuring purity in transcriptomic profiles amidst such tight cellular interactions remains a challenge.
Figure 2: Segmentation by the DSP platform allow profiling of more specific gene expression features. (a) Predicted proportion of SKBR3 and Jurkat cells in segmented DSP AOIs and Visium spots in cell array samples. (b) Example of segmented DSP AOIs on cell array samples. All cells were labelled with SYTO13 for nuclei stain. Jurkat and SKBR3 cells were labelled with anti-CD45 (red) or pan-cytokeratin (green) antibodies respectively. Epithelial or non-epithelial DSP AOIs were then sampled based on the fluorescent signals in a sequential manner. (c) Predicted proportion of cancer and TME cell types in segmented DSP AOIs and Visium spots in tissue samples. (d) Normalised expression of CD8A in CD8 and non CD8 segments in DSP data. (e) NES of top 5 significantly dysregulated GOBP pathways identified between CD8 segments and adjacent non-CD8 TME segments by the DSP platform. Significance threshold was set as q < 0.25.
Conclusion
The world of spatial transcriptomics isn't one-size-fits-all. While both DSP and Visium are powerhouses in their own right, the choice boils down to the specific research question at hand. This comparative analysis paves the way for informed decisions, enabling researchers to harness the full potential of spatial transcriptomics.
Han, Y., (2023) Publication Spotlight: DSP vs. Visium: A Comparative Study in Spatial Transcriptomics for Cancer Research - Crown Bioscience. https://blog.crownbio.com/dsp-vs-visium-a-comparative-study-in-spatial-transcriptomics-for-cancer-research
Imagine standing on the brink of a breakthrough in cancer treatment, only to be halted by one daunting barrier: drug resistance. In this episode of Cr…
Oncology drug approvals in H1 2025 In the first half of 2025, the FDA’s Center for Drug Evaluation and Research (CDER) approved a total of 16 novel dr…
Often referred to as “magic bullets” or “biological missiles”, antibody-drug conjugates (ADCs) are one of the most promising advances in targeted canc…