
The world of oncology is ever-evolving, and as researchers and scientists, we are perpetually on the front lines searching for innovative solutions against cancer. One promising direction is the exploration of drug combinations. The idea is both simple and profound: what if we could combine two or more drugs, amplifying their effects to produce outcomes greater than their individual impacts? Welcome to the world of drug synergy!
Why Combine Drugs?
It's well-known that cancer isn't just one disease; it is a myriad of diseases with intricate gene and molecular interactions. A single drug might target one pathway, with other pathways potentially left untouched, allowing the cancer to adapt and develop resistance. This is where drug combinations come in. By targeting multiple pathways simultaneously, drug combinations can:
- Reduce resistance: Multifaceted attacks lessen the chance for the cancer to develop resistance to the treatment.
- Increase potency: Drugs can amplify each other's effects, resulting in more profound tumor suppression.
- Minimize side effects: By using lower doses of each drug, adverse reactions can be reduced while maintaining efficacy.
Assessing Drug Synergy in In Vitro Studies
While the concept of drug combinations is enticing, the challenge has always been to determine which combinations truly work synergistically. Historically, drug synergy was explored primarily using sophisticated statistical methods in cell lines. These in vitro studies, involving cell lines or organoids, offer initial insights into how drugs might interact. They hold invaluable worth for screening potential combinations before they progress to animal or human trials.
Breakthroughs and Challenges in In Vivo Models
However, there's a significant gap when it comes to animal studies. In vivo drug synergy studies using mouse tumor models have lacked robust statistical methods, leading to potential false positives. Consider the implications: drug combinations that demonstrate "synergy" in animal studies might fail in clinical trials, resulting in a waste of time and resources.
This is where our recent publication in Cancer Research Communications becomes a game-changer. We introduced a method, for the first time, that reliably identifies drug synergy in PDX, CDX, and syngeneic models. This method is unique in its ability to calculate synergy directly from tumor volume data without making assumptions about tumor growth behaviors.
Key highlights from our research:
- invivoSyn Approach: This method uses an efficacy metric called eGR, which gauges the average tumor growth rate over a study period. It factors in the variability in tumor volumes among mice and calculates synergy scores, combination indexes, and statistical confidence intervals (Figure 1).
- Validation of In Vitro Drug Synergy in In Vivo Studies: Using invivoSyn, we confirmed that combinations showing synergy in cell lines also demonstrate synergy in mouse models. For instance, the combination of SN-38 and rabusertib reduced tumors more effectively in mice than individual treatments (Figure 2).
- Direct Assessment of In Vivo Combination Effects: The team's method directly assessed combination effects in mice, revealing insights into the role of tumor immunity in different models. A notable discovery was the antagonism seen when combining anti-PD-1 and anti-CD8 treatments.
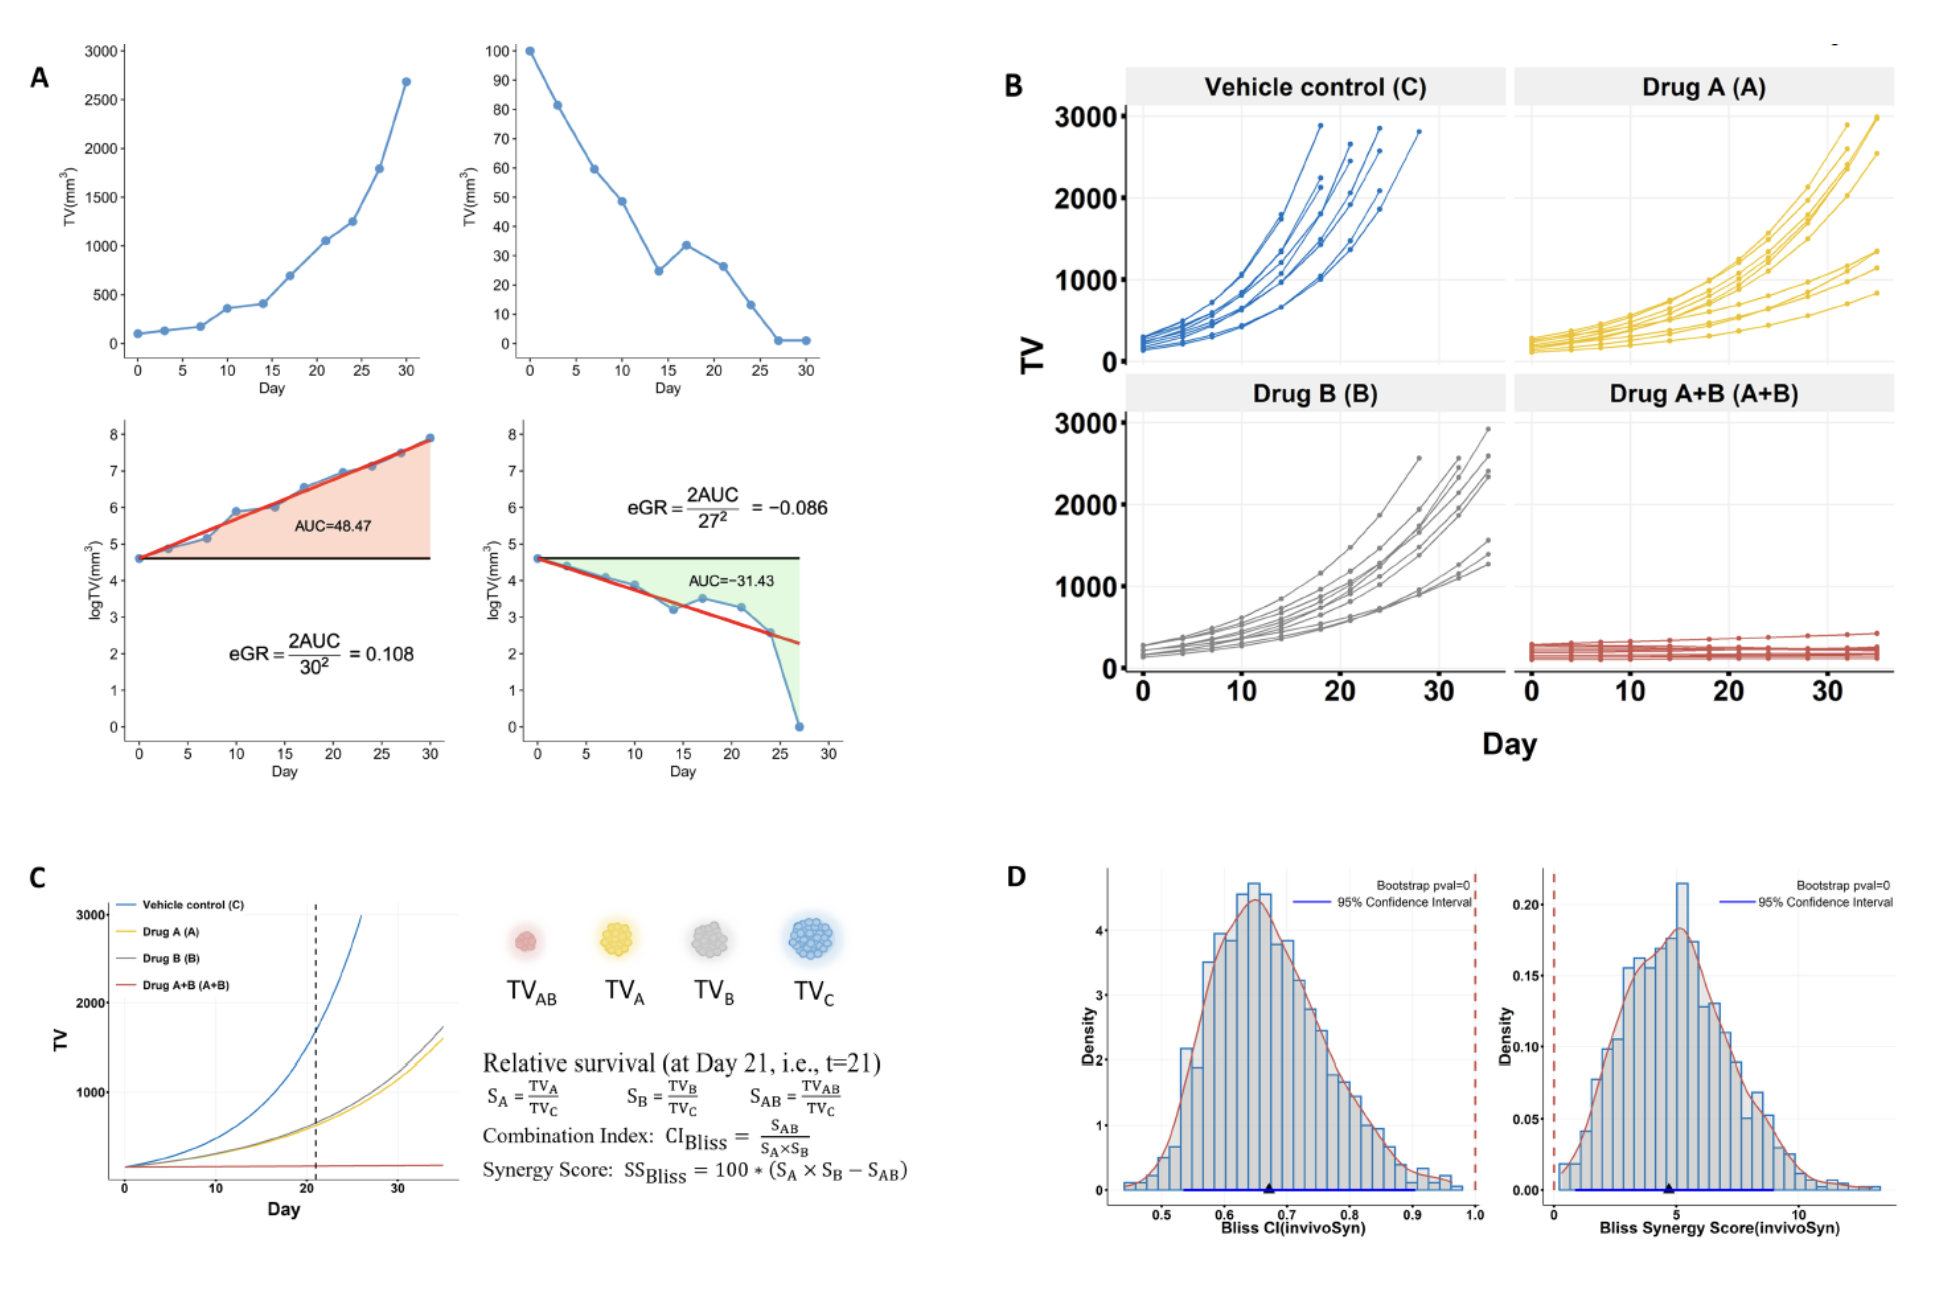
Figure 1. The quantification of in vivo synergy based on an unbiased metric of drug effect.
(A) Definition of eGR, an unbiased metric of in vivo drug effect. Upper graphs show two synthetic curves, for illustrative purposes, depicting tumor growth and shrinkage measured by tumor volume (TV). Bottom graphs show the same tumor growth curves in natural log scale and illustrate the calculation of eGR, which is defined as 2AUC/d2, where AUC is the size of the colored area and d is the study duration in days (see Methods in the publication for details).
(B) The four-arms design is the most common in vivo combination study, which has four treatment groups for the vehicle control, drug A, drug B, and drug A+B, with fixed doses for the two drugs. A group usually has multiple mice that vary in tumor growth curves and the number of TV data points.
(C) The average tumor growth curves of the four groups. The relative survival is calculated for drugs A, B, A+B based on TV on a particular day, and then the combination index (CI) and synergy score (SS) are estimated under several models, only Bliss independence model is shown in this figure.
(D) Bootstrap confidence intervals and p-values are calculated for both combination index and synergy score. The histogram, overlaid by a red fitted density curve, shows the distribution of 1000 bootstrap values for CI or SS; the red dashed vertical line indicates additive effect (1 for CI and 0 for SS); the blue triangle marks the calculated value for CI or SS; the blue horizontal line indicates the 95% confidence interval. invivoSyn is the name of our method as well as the software package implementing it.
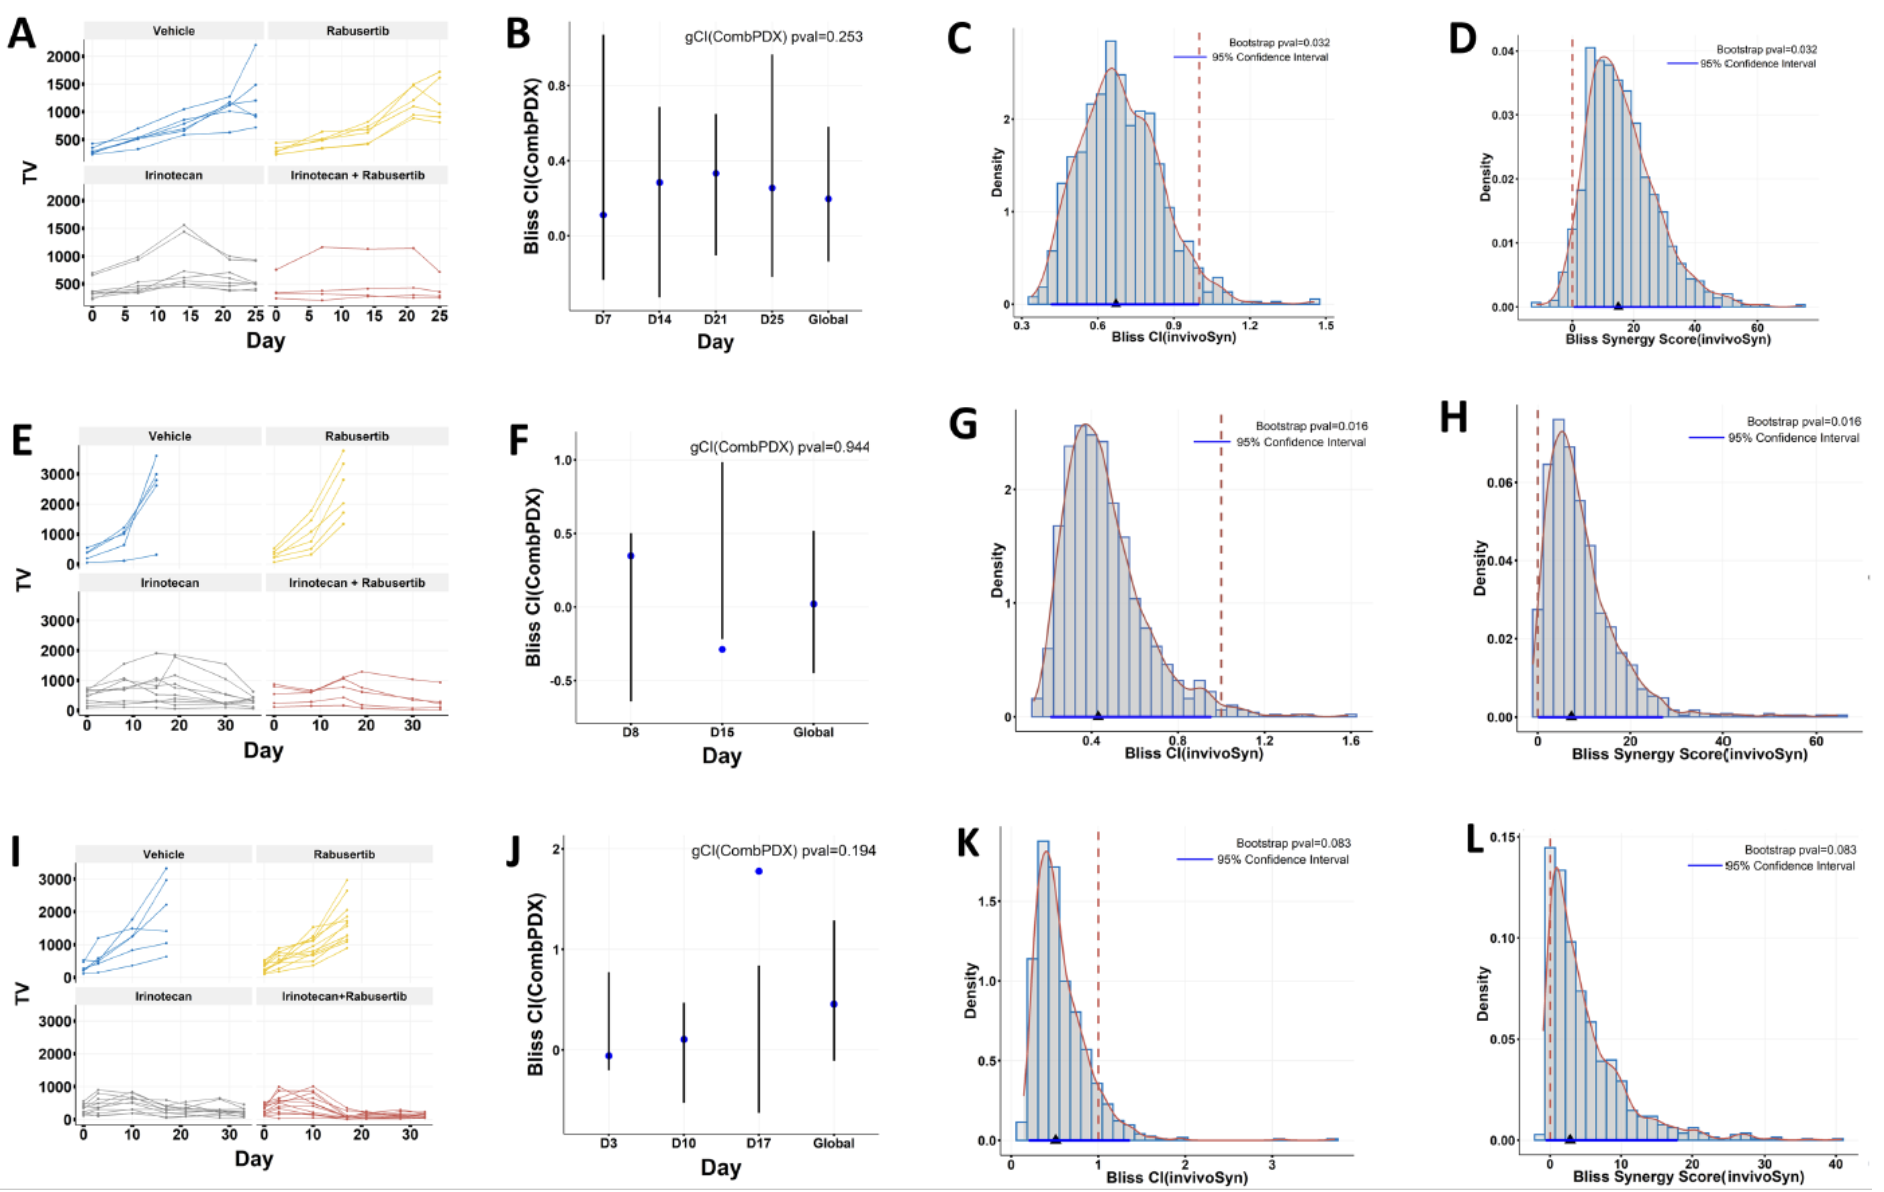
Figure 2. Validating in vitro drug synergy in in vivo combination studies.
The TOP1 inhibitor irinotecan and the CHEK1 inhibitor rabusertib exhibited significant synergy in three colon cell lines and were subsequently evaluated in related cell line-derived xenografts. The in vivo combination impacts of these drugs were reassessed using both the CombPDX and invivoSyn methodologies for the trio of xenografts: SW837 (A-D) Tumor growth curves (A). Local combination index and global combination index (gCI) values, complemented by 95% confidence intervals and p-values, based on the Bliss independence model via the CombPDX method (B). Density distribution of the Bliss combination index (CI) values informed by 1000 bootstrap resamples. The actual CI value (represented by a blue triangle), its 95% confidence interval (illustrated as a blue line), and its p-value were all derived using our invivoSyn technique (C). A red dashed vertical line indicates an additive effect (1 for CI and 0 for SS). Analogous details for Bliss synergy scores via the invivoSyn method (D). SNU-81 (E-H) and LS-1034 (I-L) follow a similar pattern as SW837. Results in segments (B, F, J) were visualized using data from the CombPDX website. Blue markers represent local CI values, while vertical lines signify the 95% confidence intervals. It's worth noting that certain local CI values inaccurately fall outside their respective 95% confidence brackets.
Conclusion
Concluding, the invivoSyn framework emerges as a potent tool for evaluating drug synergy in vivo. The knowledge it offers is rooted in solid statistical methods, aiding in the design and interpretation of combination therapy studies. As drug combinations remain pivotal in therapeutic strategies, especially in oncology, tools like invivoSyn will become invaluable in guiding experimental designs and, consequently, therapeutic interventions. Future endeavors could focus on assimilating other models of drug interaction with invivoSyn, ensuring its findings resonate with even more diverse datasets.
CrownSyn — in vivo: Leading the Future
Our innovative approach is set to redefine industry benchmarks. For oncology experts, there's exciting news: We proudly present CrownSyn — in vivo, a premier service by Crown Bioscience. Our aim? To elevate drug synergy research in in vivo models, ensuring robust testing and validation before clinical trials.
As leaders in preclinical oncology CRO, Crown Bioscience remains at the forefront of innovation. With tools like CrownSyn — in vivo, we're shaping a promising future in oncology research.