Mouse Clinical Trial Study Design Optimization through Improved Analysis
Mouse clinical trials (MCTs) are population studies using PDX models to assess efficacy and predict drug responders in preclinical oncology drug development. More closely replicating the clinical trial situation than other preclinical studies, MCTs provide highly predictive data and are becoming more widely used.
Similar to human clinical trials, mouse clinical trial drug efficacy is currently analyzed using endpoint-based approaches. We’ve previously covered why this is not the best method, with endpoint-based approaches not using the full dataset generated by the MCT.
Instead, a linear mixed models (LMMs) framework takes advantage of all the data points generated, to model and describe heterogeneity in growth and drug response between PDX models and mice. LMMs have many applications in improving MCT operation and analysis - this post specifically looks at how to use LMMs to optimize MCT study design.
Using LMMs to Optimize MCT Study Design
Some of the most frequently asked questions when designing an MCT are:
How many PDX should be used for any given study?
How many mouse models should be used for a study?
Is this affected by drug potency?
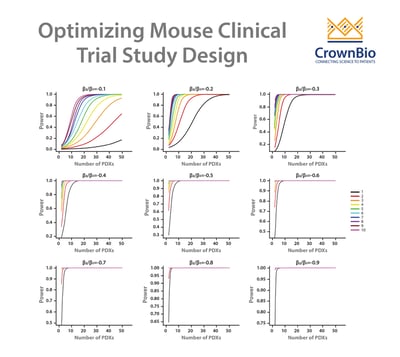
A LMM can be used to answer these questions and therefore optimize study design for efficacy testing. By applying a LMM to a power analysis of MCT datasets, statistical curves are developed which help to guide on PDX and mice needed, and which are based around drug potency.
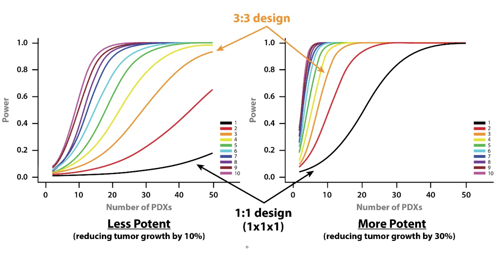
Our example here features cisplatin treatment data, collected for 42 PDX across esophageal, gastric, and lung cancer models from studies where cisplatin acted as positive control. Each PDX was implanted into 5-9 mice. Power curves were then generated for:
A less potent drug – slowing down tumor growth by 10%.
A more potent drug - reducing tumor growth by 30%.
From the curves, you can see that if you want to use a 1:1 MCT design (i.e. one mouse per model per treatment group) and achieve 80% power then you need around 28 PDX for a more potent drug, and 100 PDXs for a less potent drug.
If you moved to a 3:3 design and wanted the same power then 11 and 40 PDX would be needed for more and less potent drugs, respectively.
While curves will vary for agents other than cisplatin, due to different response profiles and variance, overall trends will be similar. This sets up some general guidelines for planning MCTs:
If you are using many PDX, employ a 1:1 design; when using fewer PDX models, increase the number of mice for each PDX.
The power increase from a 1:1 to 2:2 design and from a 2:2 to 3:3 MCT design is large. After this, the power increase is lower as you move through 3:3 to 4:4, 4:4 to 5:5 etc design. This means that three mice/PDX seems to be a good balance.
If testing a more potent drug you need fewer mouse models for efficacy testing.
Choose Model Numbers Based on Study Aims
While these provide general guidance for choosing PDX/mouse model numbers, you should also balance this with your study aims. Guidelines above are for efficacy testing. If you want to use an MCT specifically for biomarker discovery more models should be added to allow a diverse tumor representation rather than just thinking about statistical factors.
Further Benefits of LMM in Mouse Clinical Trial Study Design
LMM can also address some additional study design questions. Within traditional data analysis starting tumor volumes need to be matched, but this is not needed for this more sophisticated system.
LMMs also explicitly model growth rate. This helps to overcome issues with tumor growth rate variability (which impacts tumor growth inhibition) and provides a better assessment of drug efficacy. Using a LMM also helps account for dropouts and missing MCT data points.
Conclusion
Designing and optimizing mouse clinical trials often starts with the same questions around finding the right number of PDX and mice for your agent. Using an LMM approach is a proven method and key to MCT optimization.
Cite this Article
Barbeau, J., (2020) How to Optimize Mouse Clinical Trial Study Design - Crown Bioscience. https://blog.crownbio.com/how-to-optimize-mouse-clinical-trial-study-design
Imagine standing on the brink of a breakthrough in cancer treatment, only to be halted by one daunting barrier: drug resistance. In this episode of Cr…
Oncology drug approvals in H1 2025 In the first half of 2025, the FDA’s Center for Drug Evaluation and Research (CDER) approved a total of 16 novel dr…
Often referred to as “magic bullets” or “biological missiles”, antibody-drug conjugates (ADCs) are one of the most promising advances in targeted canc…