 Learn how to correctly quantify drug efficacy and effects in mouse clinical trials using a linear mixed models statistical framework.
Using Linear Mixed Models to Optimize Mouse Clinical Trials
Mouse clinical trials (MCTs) represent a new approach to preclinical efficacy studies in oncology, more closely recapitulating the clinical set up. Panels of PDX models are used to identify responder and non-responder populations, to more accurately predict who’ll benefit most in the clinic.
We’ve previously written about the analysis of MCTs, and how this needs to be enhanced – to move beyond the endpoint-based approaches which mimic clinical trial analysis. These approaches don’t take advantage of the wealth of data generated by these clustered longitudinal studies.
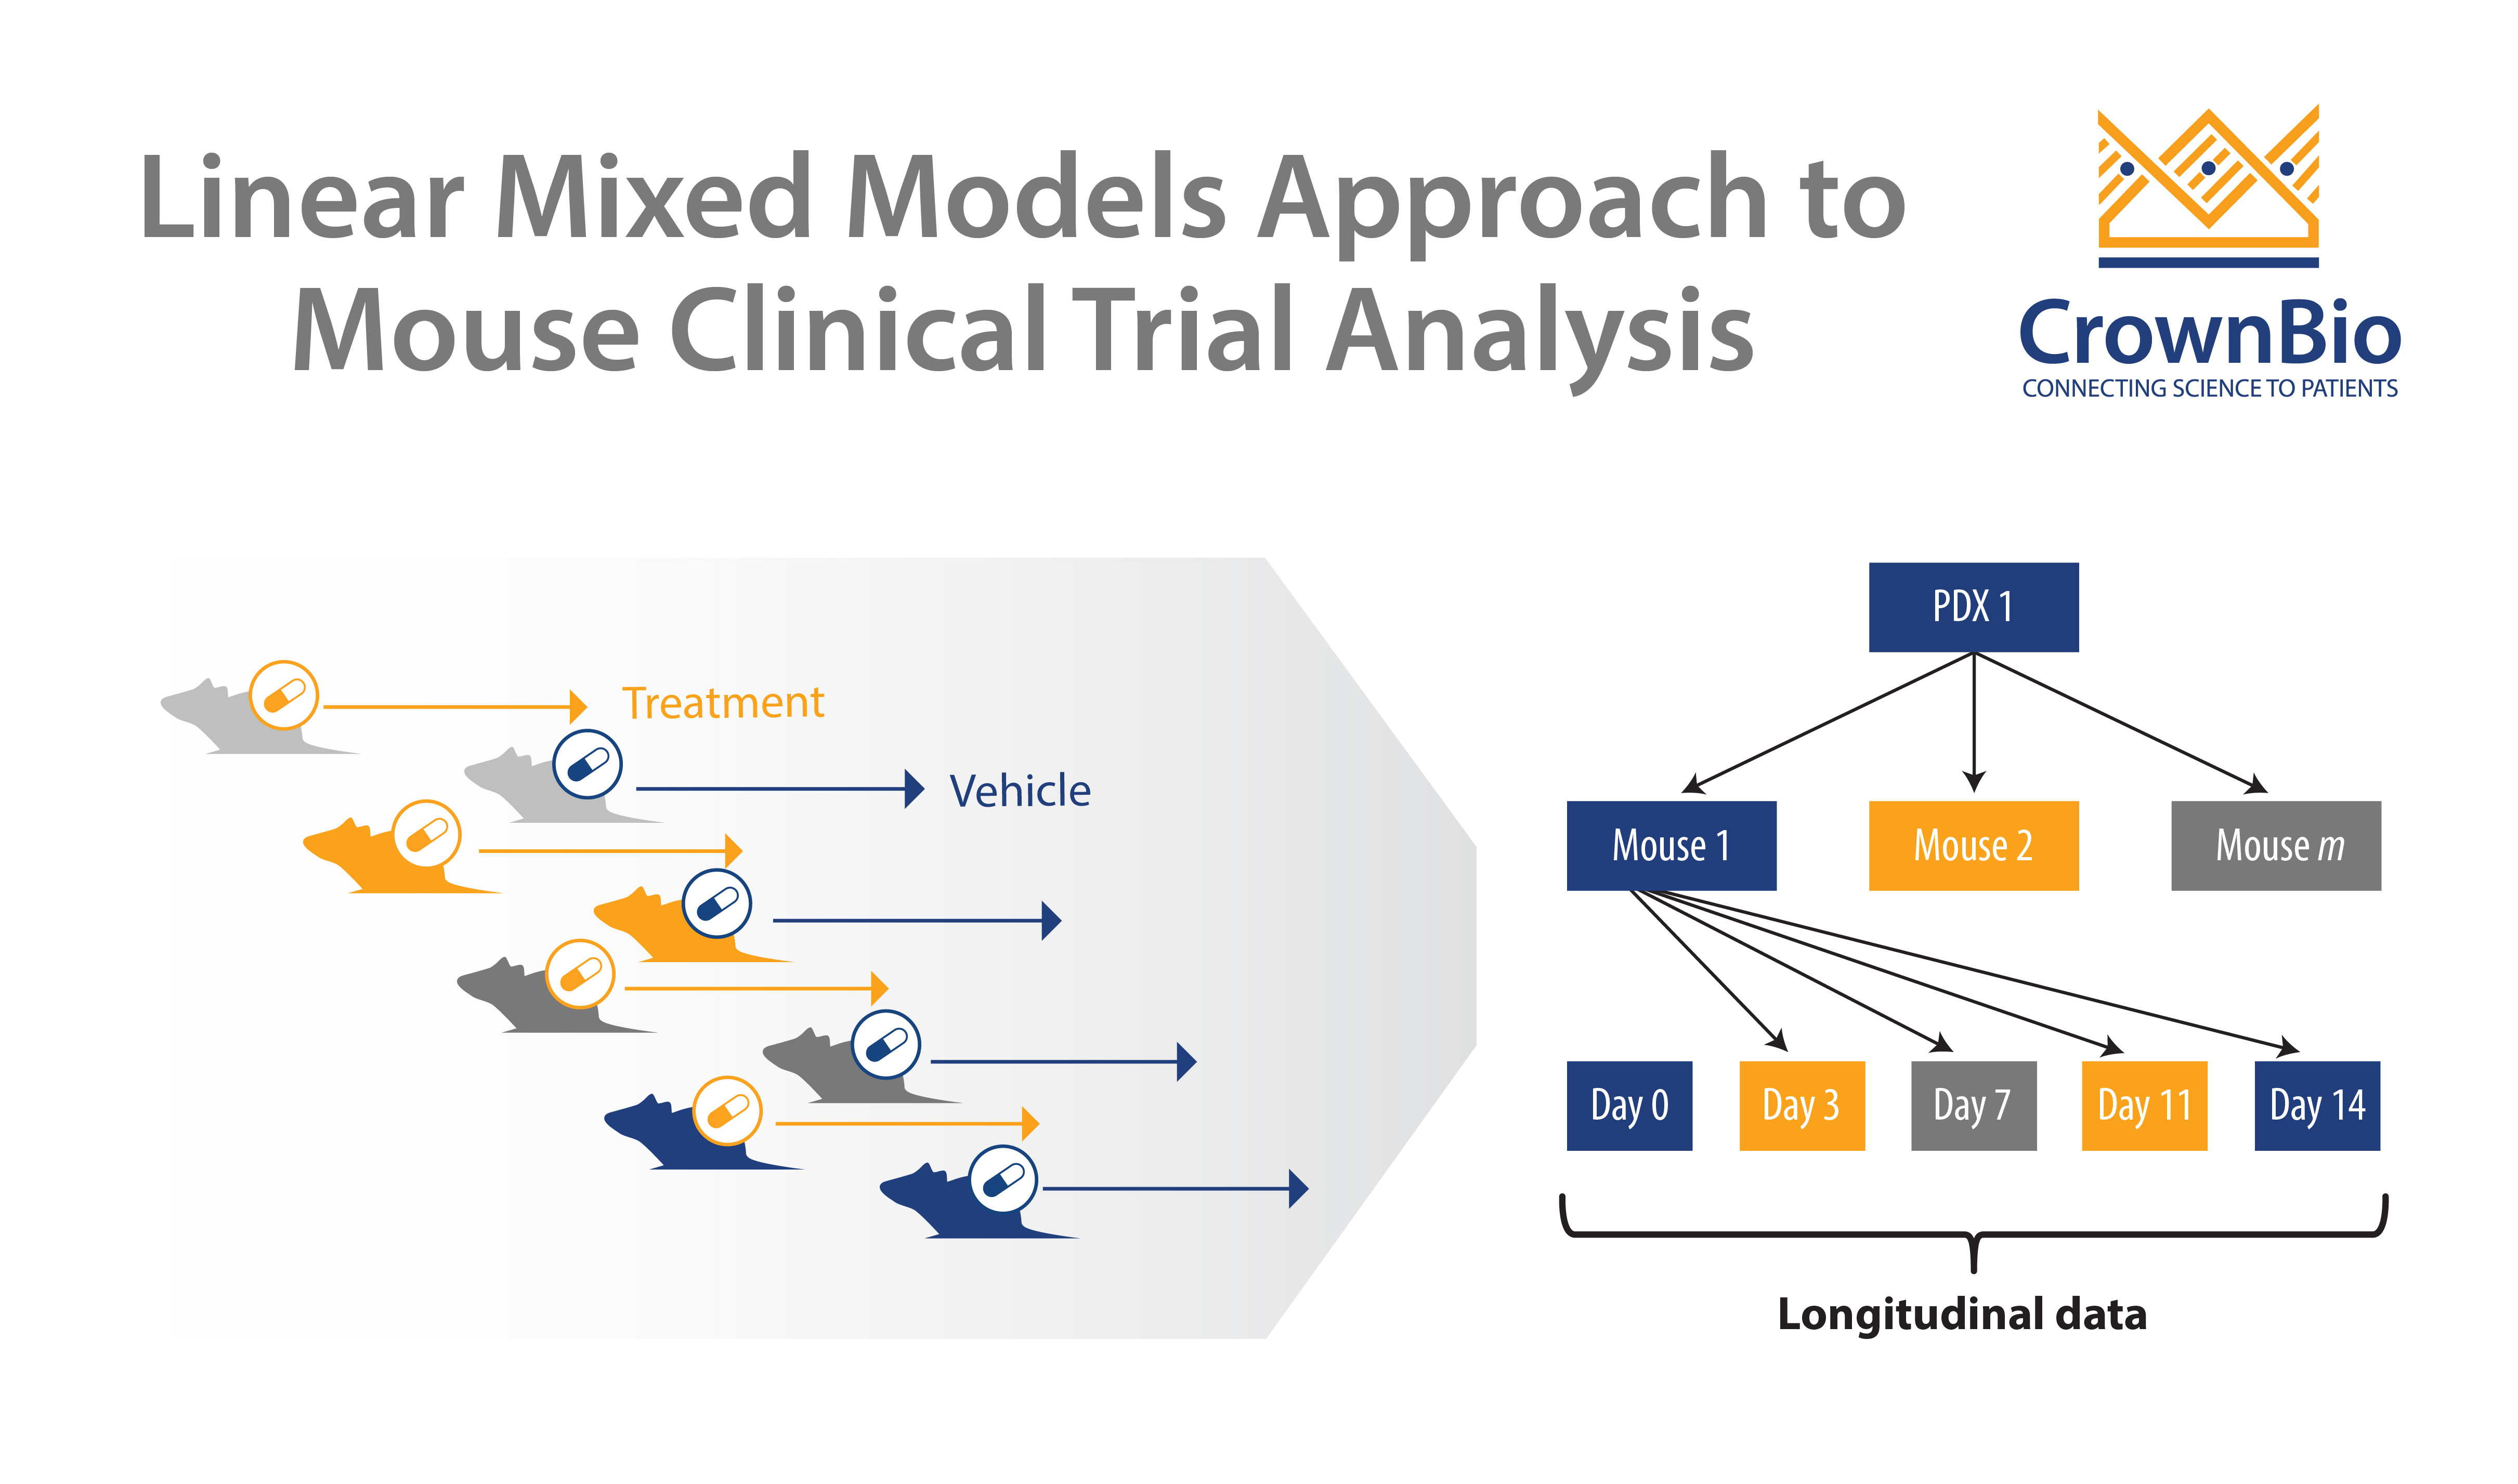
A new linear mixed models (LMMs) approach has been devised which can model and describe heterogeneity in growth and drug response data from MCTs, and which is applied to answer fundamental MCT questions on study design and analysis.
Our previous post in this series looked at using LMM to guide study design, and this post reviews how LMM are used to correctly quantify drug efficacy and effects within a MCT.
Quantifying Efficacy Across Indications and Drugs
When you start analyzing MCTs, common questions include how to correctly quantify differences in efficacy across various tumor indications and between different anticancer agents.
The answer is to apply a LMM statistical framework to the data, and then readout a variety of parameters to correctly identify trends. Imagine you start with an MCT dataset where one drug has been tested across a variety of cancer indications.
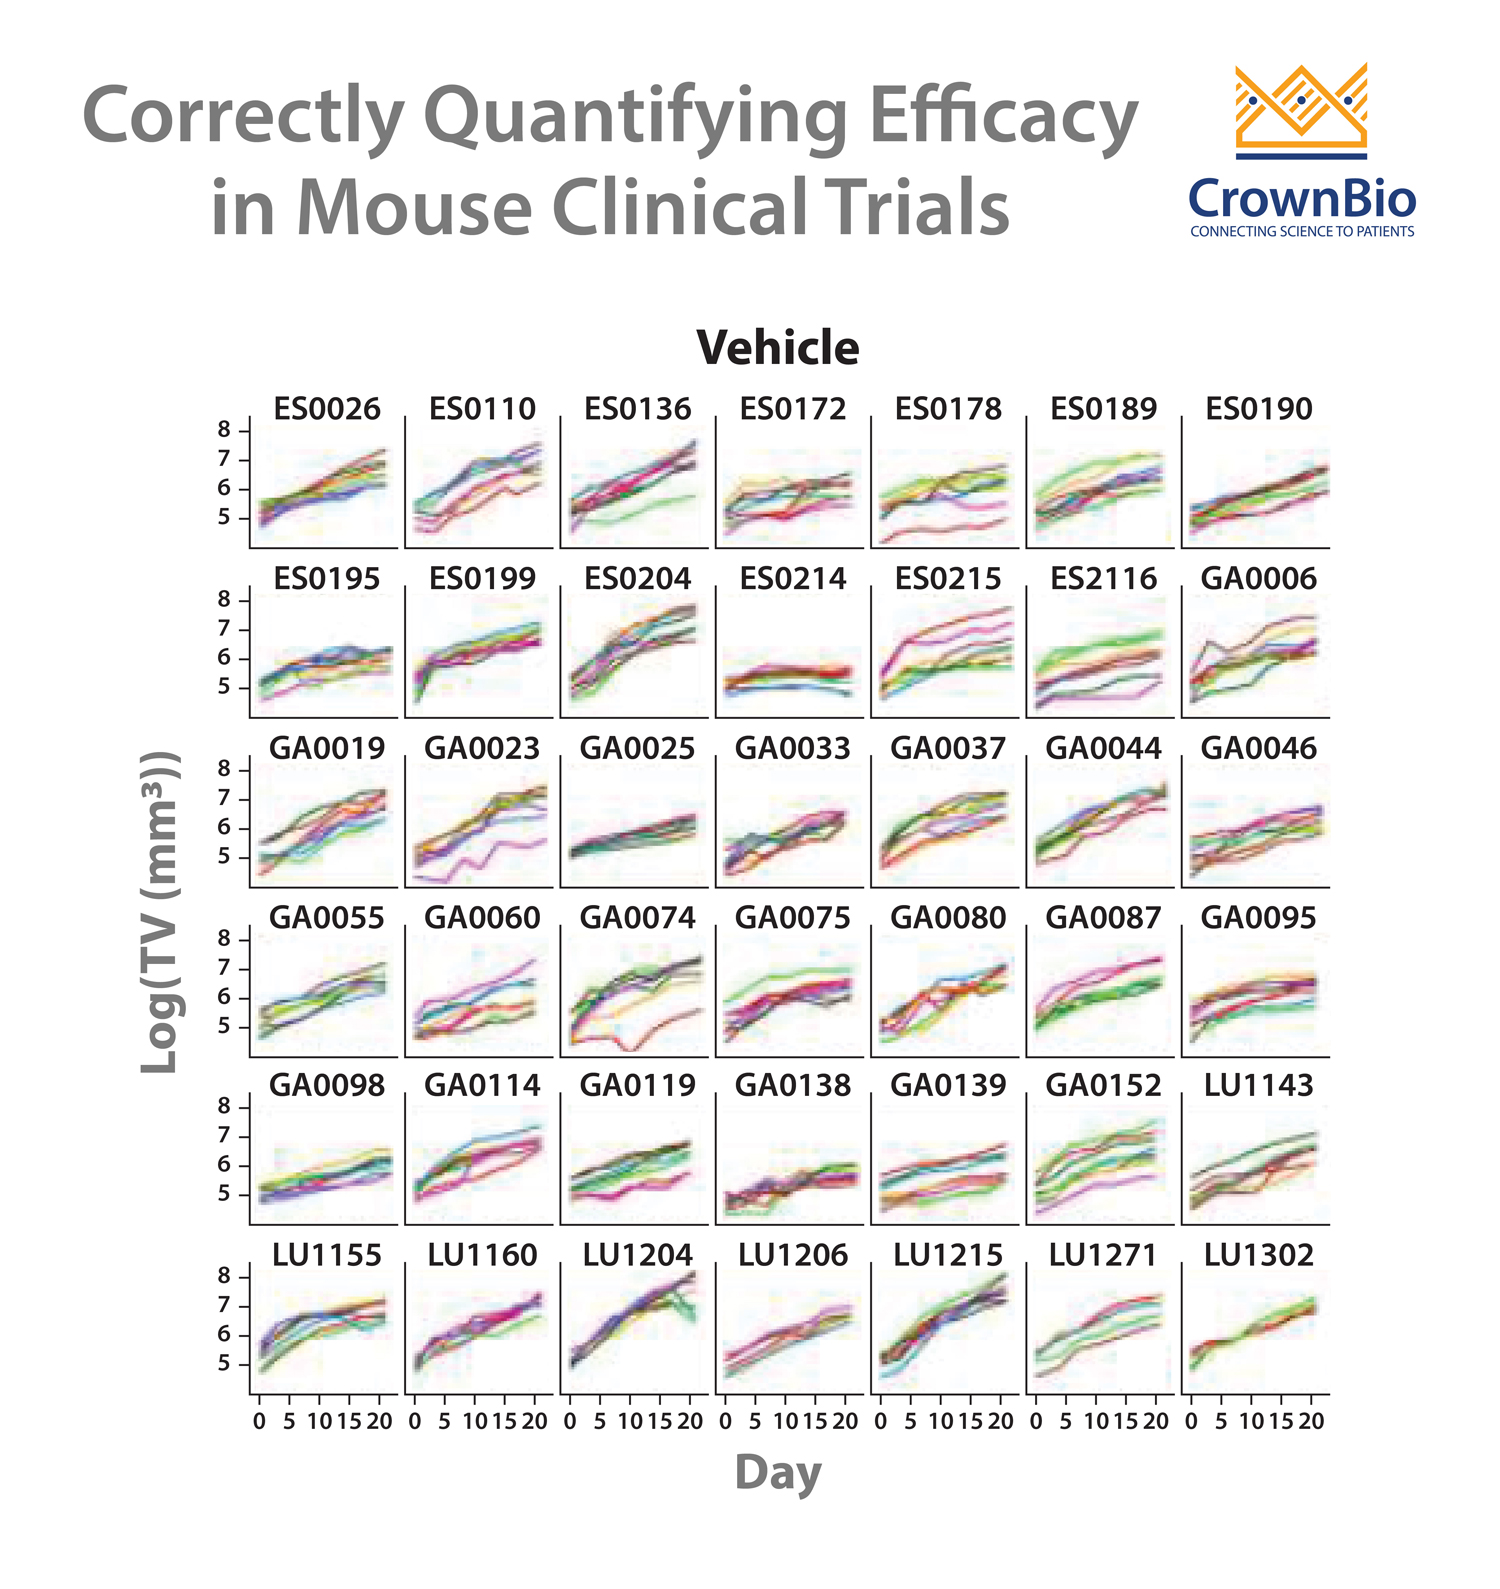
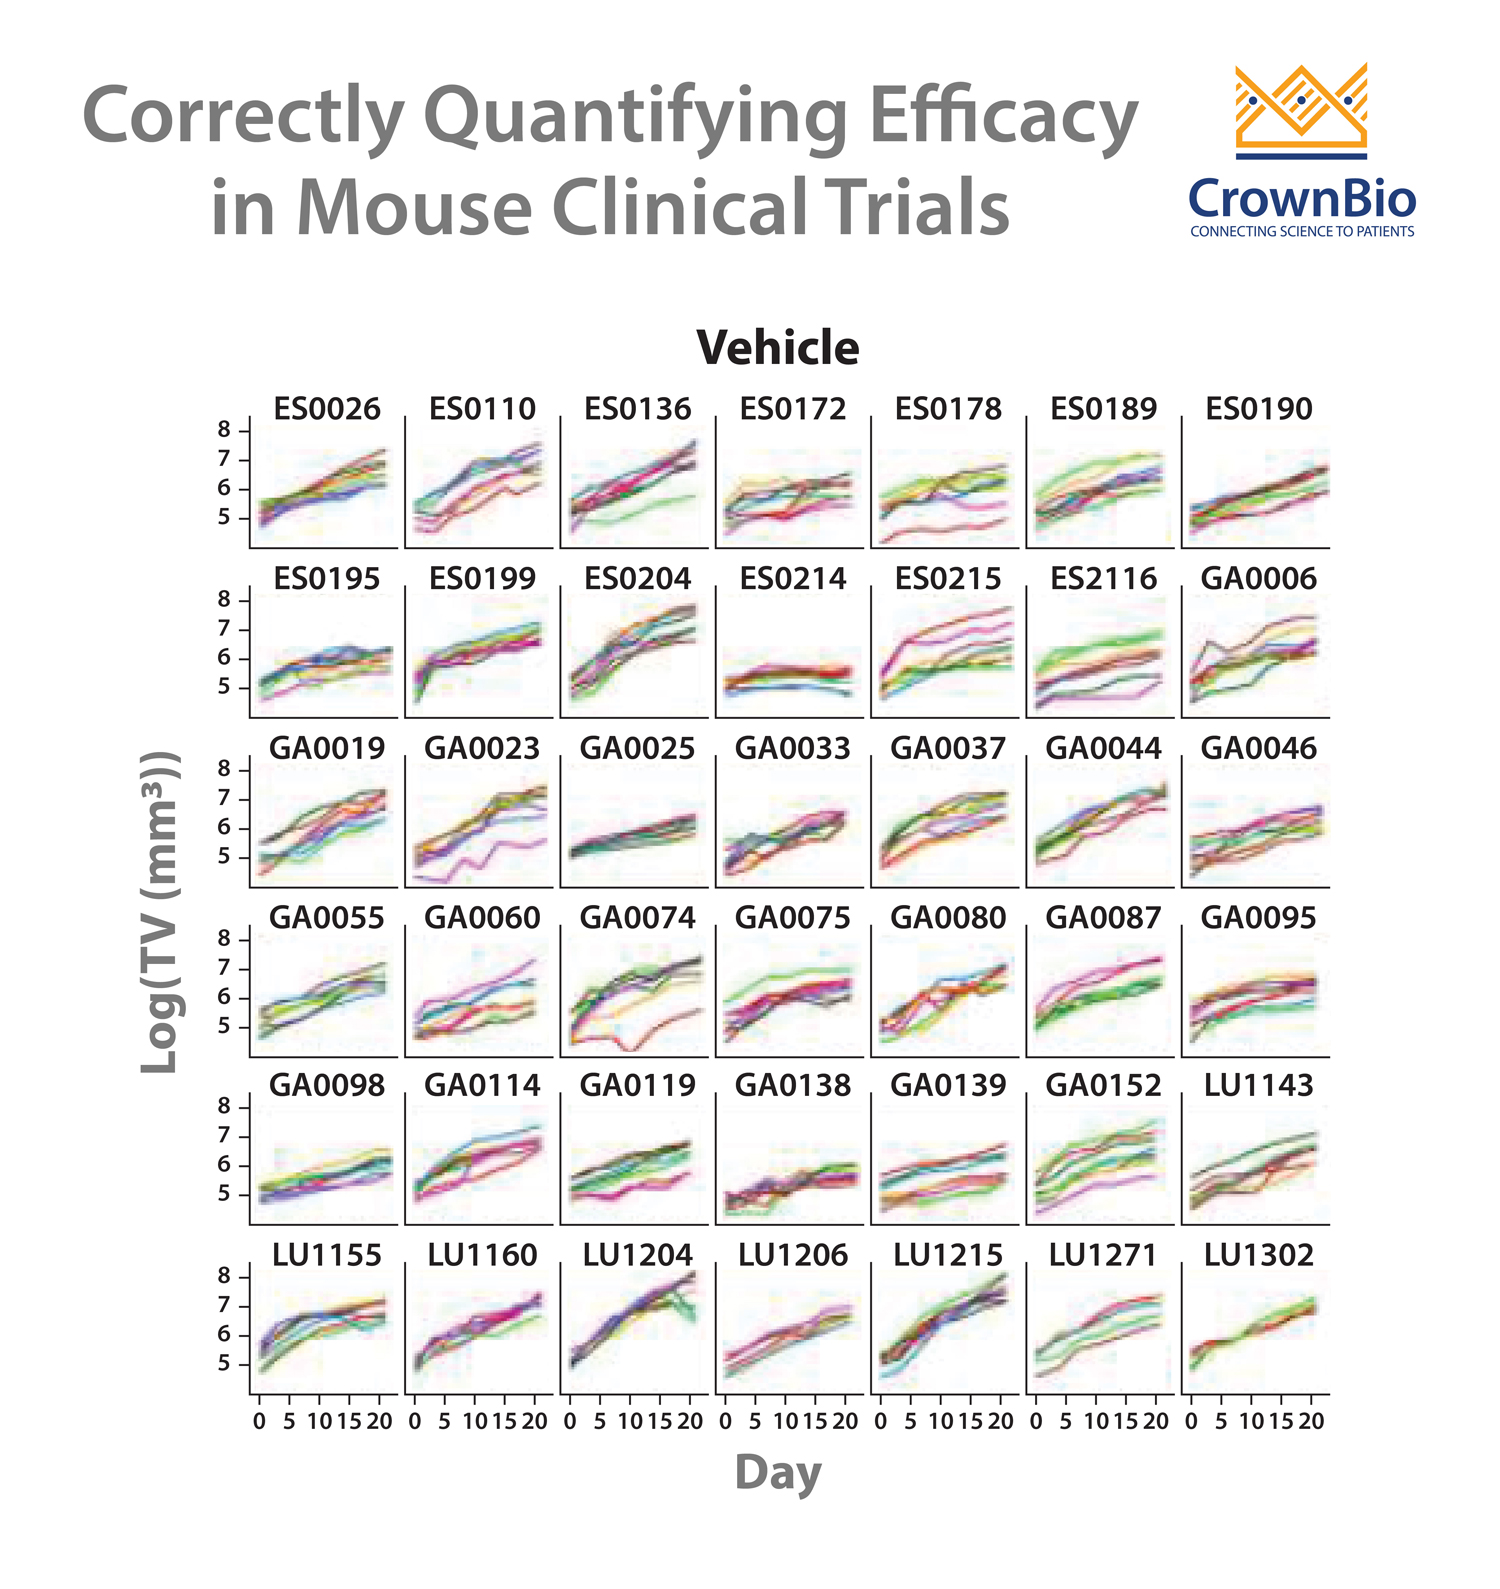
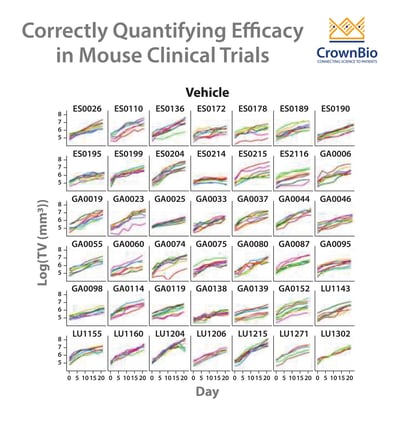
To start the analysis, first your tumor growth curves are converted to log scale, to show linearity. This data can then be fitted to a LMM with a variety of parameters comparing tumor growth for the different indications following treatment with vehicle or your drug.
Parameter values can then be compared. For instance, tumor growth of cancer A under vehicle is compared with tumor growth of cancer B under vehicle. Looking at the p value for this comparison will show you if you have no differences (meaning tumor growth is similar), or showing a significant p value (meaning one cancer is growing more rapidly than the other).
Similar analyses can then be performed for treatments – looking at treatment effect for each cancer (with p values revealing efficacy or no efficacy) and then comparing cancers. The resulting p values will highlight if there is any difference between agent treatment effect for each cancer type.
If your MCT includes different agents, single or combination regimens, then similar analyses can be performed to give you definitive results on the treatment effects of the various agents/regimens on the cancer type(s) being studied.
Evaluating Drug Effects Beyond Conventional Survival Analyses
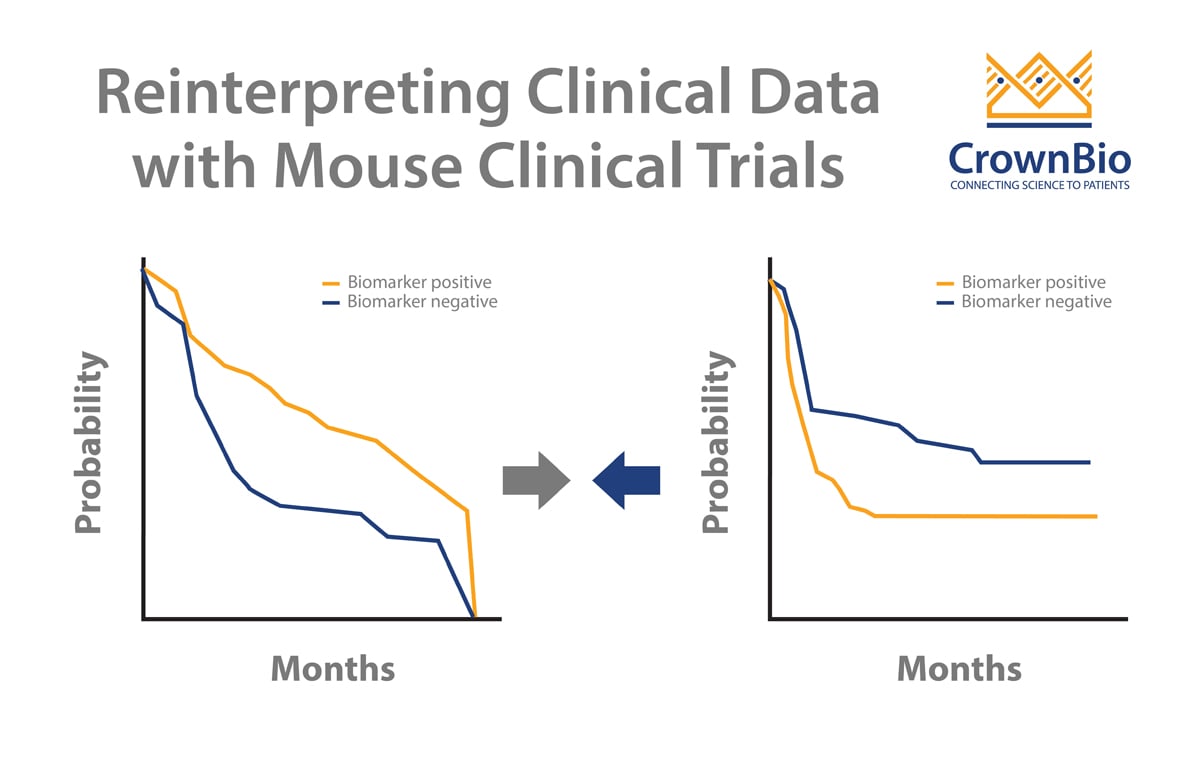
Another use for LMMs in MCT analysis is to correctly evaluate drug effects, by moving beyond conventional survival analyses. In the clinic, Kaplan-Meier survival analysis is performed as patient survival is independent from each other. Model survival in MCTs is however not independent, which means Kaplan-Meier or the Cox proportional hazards model is not appropriate.
Instead, an additive frailty model (an extension of the Cox proportional hazards model) can be used to correctly evaluate drug effect in MCTs. The additive frailty model has two frailty terms, which quantify both the PDX growth rate and drug response heterogeneity. This means that this analysis more fully models the heterogeneity of hazard and drug efficacy within the clustered population structure of MCTs. PDX heterogeneity can be severely misestimated when using other models.
Resulting overall survival data and hazard ratios are more accurate, providing a superior model over conventional survival analyses.
Conclusion
To quantify drug efficacy and effects in mouse clinical trials, as well as maximize mouse clinical trial data, it’s important to perform the right analyses leading to the most informed conclusions. Linear mixed model approaches allow the correct quantification of drug efficacy across cancer indications and different agents. An additive frailty model provides accurate drug effect data, to optimize overall survival and hazard ratio results.

