Explore how to use mouse clinical trials and analysis by linear mixed models approaches to reinterpret clinical trial results, including failed trials and for biomarker validation.
Applications of Mouse Clinical Trial Analysis through a Linear Mixed Models Framework
Mouse clinical trials (MCTs) are population, Phase 2-like studies that more closely mimic clinical trials than other preclinical studies. Using panels of PDX models, MCTs provide highly predictive efficacy data and advise on responder/non-responder populations.
LMM analysis is also useful for analyzing and reinterpreting clinical results, including for biomarker validation.
Using MCTs and LMM Analysis for Clinical Biomarker Validation
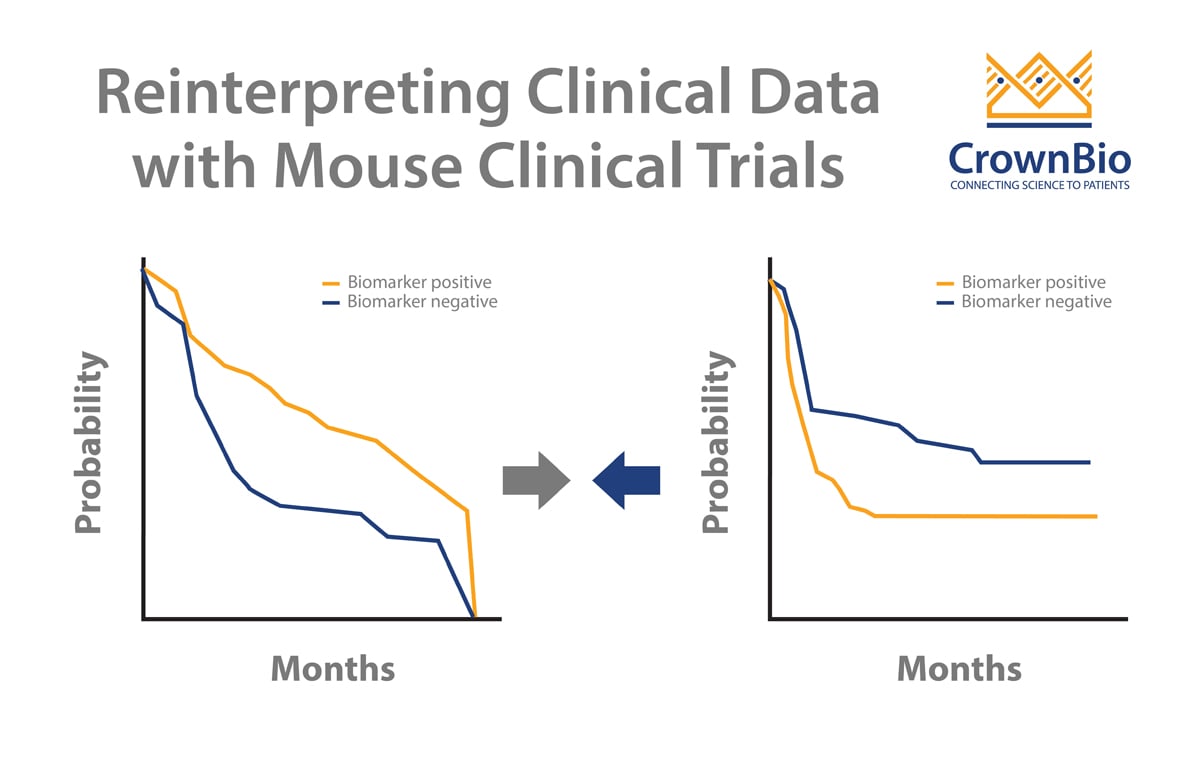
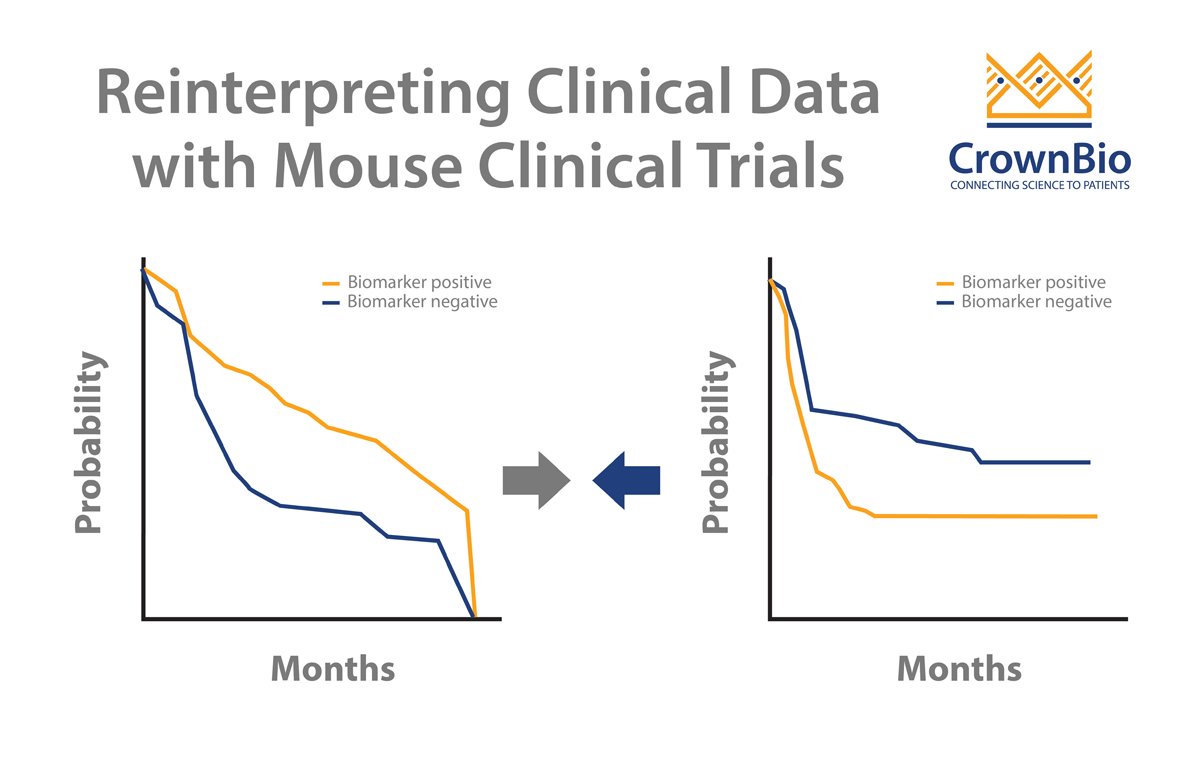
Clinical trials can sometimes throw up contradictory results. MCTs and LMM analysis can help to dig deeper into data and uncover the real trends. A good example of this looks at addressing a potential biomarker arising from clinical trials.
Two published clinical trials (Bamias et al and De Dosso et al) show a mismatch on whether ERCC1 is predictive of response to cisplatin in gastric cancer patients. This is despite the two trials having almost identical numbers of patients as well as p values from Kaplan-Meier survival analyses.
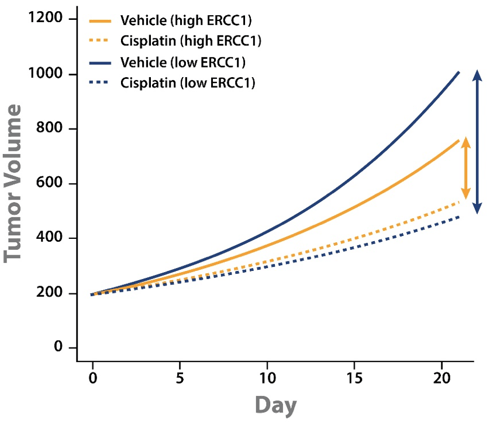
A LMM analysis of MCT cisplatin data across a panel of PDX was performed to start to address the issue. Alongside the PDX panel response to cisplatin, ERCC1 expression levels were also established by RNAseq. For the MCT panel of 42 PDX (including gastric, lung, and esophageal models) ERCC1 expression was wide ranging.
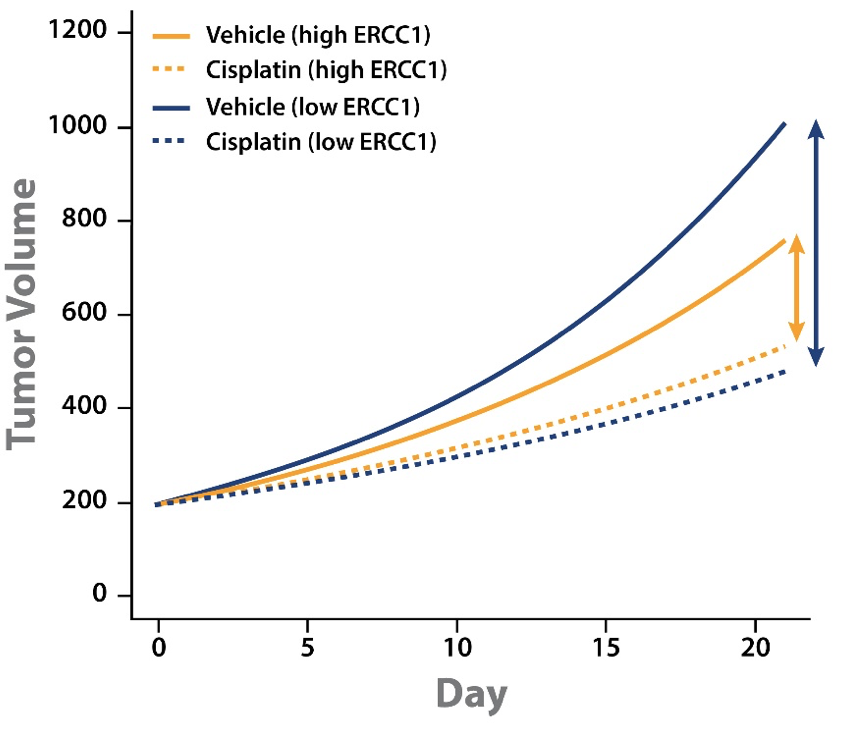
Tumor growth inhibition (TGI) data could then be separated out by models with high or low ERCC1 expression level. This analysis showed some interesting points:
Cisplatin treatment slowed tumor growth for both high and low ERCC1 expressing PDX.
The difference in magnitude between vehicle and cisplatin groups for high and low ERCC1 expressing PDX shows that cisplatin has a greater effect on the low ERCC1 expressing PDX.
This analysis goes some way to explaining the conflicting clinical results. PDX with low ERCC1 expression levels have faster tumor growth and benefit from cisplatin treatment. It should follow that ERCC1-negative patients would benefit more from cisplatin treatment, and would therefore have a worse prognosis if not treated.
Cisplatin treatment would improve their prognosis, but it’s not known if their overall prognosis is better than that of ERCC1-positive patients.
Applying MCTs and LMMs to Reinterpret Failed Clinical Trials
A main use of MCTs is to identify responder and non-responder subgroups within the preclinical setting, to improve patient stratification in the clinic. MCTs and LMM analysis can also be used to reassess failed clinical trials to look for specific patient subsets that might still benefit from treatment.
However, using an endpoint based analysis approach, like TGI, has limitations. This includes a dependency on calculation day, initial tumor volume difference between arms, and tumor growth rate. The actual correlation between TGI with efficacy is weak. However, if a LMM is applied to model a gene’s effects on tumor growth, it does still show that EGFR is the top ranked gene.
In the clinic, a randomized Phase 3 open label trial looked at the benefit of adding cetuximab to capecitabine-cisplatin for advanced gastric cancer patients. The paper found no additional benefits of adding cetuximab to this regimen.
The results can be reinterpreted though, specifically looking for patients with high EGFR protein expression scores (>200). This finds 29 people from the trial, 21 receiving only chemotherapy and 8 patients with added cetuximab. Looking at the survival results, a clear difference is observed for cetuximab addition:
Median PFS of 4 months for patients on chemotherapy alone vs 8 months with cetuximab addition.
Median OS of 10.1 months for patients on chemotherapy alone vs 19.5 months with cetuximab addition.
For this distinct subset of patients, it appears that cetuximab does provide clinical benefit, rescuing this subset from the failed clinical trial.
Conclusion
Mouse clinical trials and sophisticated analyses provide a solution for assessing conflicting clinical data, and close analysis of failed clinical trials. For potential biomarkers, MCTs provide an ideal study type for the job, allowing measurement of tumor growth with vehicle treatment.
Cite this Article
Barbeau, J., (2020) How to Use Mouse Clinical Trials to Reinterpret Clinical Results - Crown Bioscience. https://blog.crownbio.com/how-to-use-mouse-clinical-trials-to-reinterpret-clinical-results
Imagine standing on the brink of a breakthrough in cancer treatment, only to be halted by one daunting barrier: drug resistance. In this episode of Cr…
Oncology drug approvals in H1 2025 In the first half of 2025, the FDA’s Center for Drug Evaluation and Research (CDER) approved a total of 16 novel dr…
Often referred to as “magic bullets” or “biological missiles”, antibody-drug conjugates (ADCs) are one of the most promising advances in targeted canc…