Drug attrition rates remain high, and this has been attributed in part to the poor translatability of current preclinical data. Models that have higher predictivity of patient response are needed.
In this post, we explore how developing effective dosing strategies by leveraging 3D in vitro models (e.g., organoids, cell lines grown in 3D, and ex vivo patient tissue (EVPT)), that more closely recapitulate the complex in vivo environment, can be used for making better decisions, including single or multi-drug combinations.
Why Use 3D In Vitro Models for Drug Screening Studies?
To overcome the poor translatability of current preclinical data, there is an immediate need for more advanced preclinical models beginning at the earliest steps of drug discovery (i.e., high-throughput drug screening (HTS)) so that the complexities of human disease are better recapitulated, allowing for better decisions earlier in drug discovery. Over the recent past, amazing technological advances have led to alternatives to traditional 2D monolayer culture systems, such as 3D in vitro organoids and EVPT platforms that more closely recapitulate the complex in vivo environment, and thus, show high predictivity of patient response.
Furthermore, using advanced 3D in vitro models has the potential to revolutionize the traditional linear drug-screening workflow, which has typically identified a lead compound first and then as a separate step, seeks to identify the target patient population. By using a matrix HTS workflow, multiple patient-relevant models can be used simultaneously to reflect patient characteristics at not only the individual patient level but also the whole patient-population level (i.e., they capture the heterogeneity observed in patient populations).
Since compounds can be screened simultaneously on a group of patient-relevant models, this enables quicker decision-making when it comes to choosing which lead compound to progress. The matrix HTS approach, which effectively is a clinical trial in a dish, represents a revolutionary approach to early drug discovery. Such high-throughput approaches can now be paired with high-content imaging (HCI) and high-content analysis (HCA) technologies to develop comprehensive cellular profiles of how your compounds are affecting cellular systems and spatial biology.
Combinatorial Drug Strategies in 3D
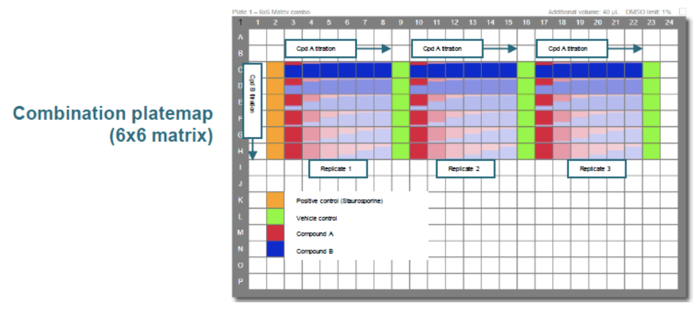
The identification and translation of effective drug combinations remains challenging, especially due to the difficulties associated with evaluating and quantifying drug combination effects. Combination screens can now be used to evaluate multi-drug strategies across multiple types of 3D in vitro models. For additional information on study design options for drug combination studies, read our previous blog post. In short, while the matrix design is the most complex, it yields highly comprehensive data, including information about drug interactions and dosing across a wider range of ratios as compared to the simpler designs. Figure 1 shows a combination plate map where multiple doses are combined in a 6x6 matrix to assess interactions at multiple dose ratios.
Figure 1: Combination platemap (6x6 matrix).
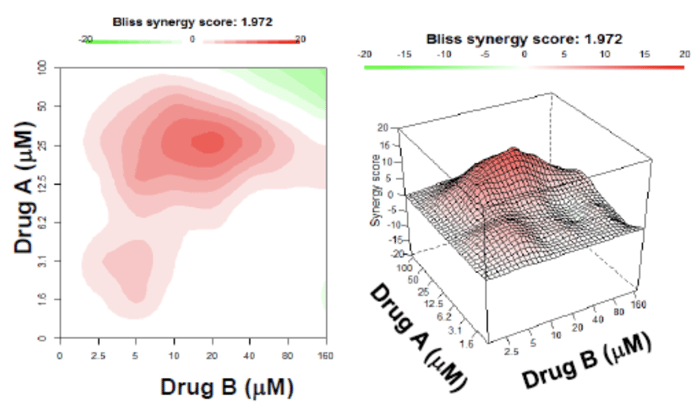
Two-drug combination effects (synergistic, antagonistic, and additive) can be evaluated and quantified using bioinformatics, such as Drug Combination Synergy Analysis (Crown Bioscience’s bioinformatics service for HTS drug combination analysis). This type of analysis can determine optimal in vivo dosing combinations before proceeding to downstream steps. Figure 2 shows a heatmap and surface plot of a Bliss independence model in synergism analysis which assesses the effects of individual drugs in a combination as independent yet competing events. This information can determine whether the probability of cell death from drug A is statistically independent of the probability of cell death from drug B in a population of cells.
Figure 2: Heatmap and surface plot of Bliss independence model in synergism analysis.
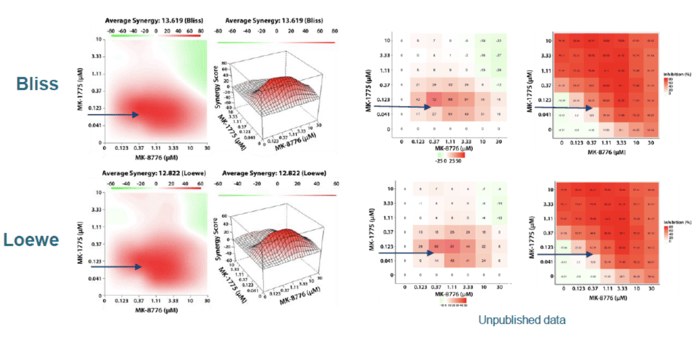
Matrix designs can be used to evaluate multiple combination strategies across multiple 3D in vitro models, such as tumor organoids. Figure 3 shows the results of combining MK 1775 + MK 8776 to treat the pancreatic cancer (PA5389B) organoid model analyzed by two different methods (Bliss and Loewe). The data show a strong synergy at low concentrations where the synergy score is represented as a 2D contour map, a 3D response surface plot, score, and dose inhibition heat map.
Figure 3: Results of combining MK 1775 + MK 8776 analyzed by two different methods (Bliss and Loewe).
In vitro Multi-drug Combination Screening Assays with Patient-Derived Cystic Fibrosis (CF) Organoids
In this section we describe the results of using Crown Bioscience’s Forskolin Induced Swelling assay to test the effects of the recently approved triple combination therapy TRIKAFTA® (consisting of the correctors VX445 (elexacaftor) and VX661 (tezacaftor) plus the potentiator VX770 (ivacaftor)) on patient-derived Cystic Fibrosis (CF) organoids (denoted as F508del/del).
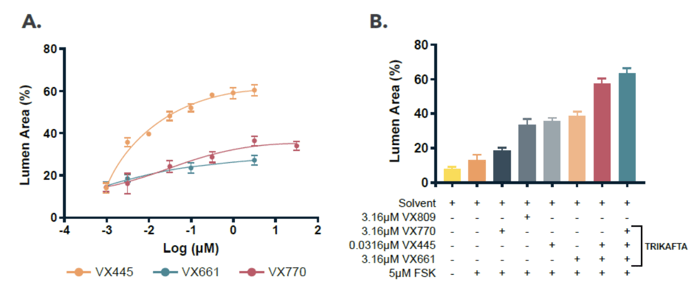
CF F508del/del organoids were seeded in 384-well plates in 3D and exposed to single CFTR modulators or combinations. Forskolin was added to induce a swelling response. Organoids were quantified with 3D proprietary image analysis software. Figure 4A shows individual dose response curves of the different components of TRIKAFTA. All compounds showed an increase in lumen area, with VX445 (orange) giving the strongest effect. A single dose was then chosen and tested in combination, and these data are shown in Figure 4B. Different effect sizes were observed after addition of the different types of CFTR modulators, with the highest increase observed for the complete TRIKAFTA mixture (final teal bar).
Figure 4: Quantified lumen area after treatment with CFTR modulators as compared to solvent control (0.2% DMSO) and stimulant only control (forskolin). Data presented as the ratio between lumen and organoid areas (avg., N=4).
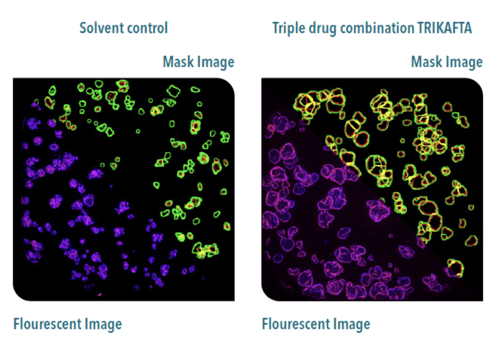
Representative images of solvent control (untreated, left) and TRIKAFTA treated (right) are shown in Figure 5. Both conditions were stimulated for three hours with forskolin, fixed, stained and analyzed. Fluorescent images (lower left) show nuclei in blue and F-actin in red. Mask images (upper right) represent the outline of the quantified organoids (green) and lumen (red). When untreated, organoids had little to no quantifiable lumen, but swelled after stimulation with forskolin. As shown, after treatment with TRIKAFTA, organoids swelled and presented with a clear lumen.
Figure 5: 3D image analysis in 3D cultured CF F508del/del organoids.
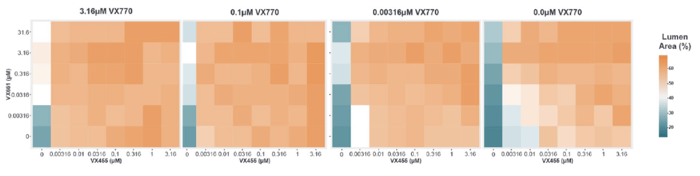
HCI and HCA were used to provide robust quantification of phenotypic changes, allowing accurate response matrix measurements, such as the combination of VX445, VX661 and VX770 in an 8x6x4 matrix in 3D cultured CF F508del/del organoids (Figure 6).
Figure 6: 3D image analysis provides robust quantification of phenotypic changes. Data are presented as the ratio between lumen and organoid areas (avg., N=4).
3D In Vitro Models in Methylcellulose and Soft Agar Assays using Cell Lines
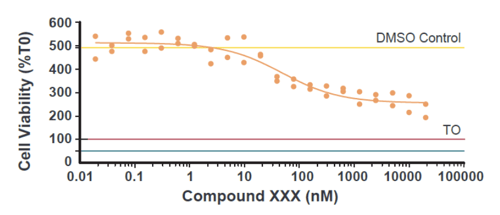
A range of commercially available in vitro cell lines have been validated for 3D assays, also available at Crown Bioscience. In short, cells are grown, harvested, and seeded on methylcellulose, soft agar, or other commercially available matrices at the appropriate dilution to achieve a final density which has been optimized for each cell line. Figure 7 shows a dose response curve for the head and neck cancer cell line FaDu, grown in 3D and treated with increasing doses of an experimental anticancer compound. Beginning at Day 2, the anticancer compound was administered to each well according to the concentration design and cell growth was monitored daily until the endpoint, when cell numbers were counted using the CellTiter-Glo® (CTG) assay.
Figure 7: Dose Response Curve for the FaDu Head and Neck Cancer Cell Line.
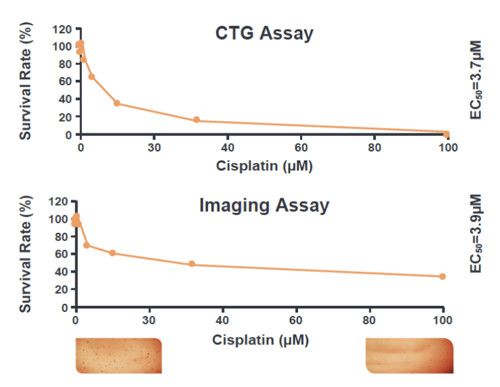
Soft agar assays in low-attachment 96 well plates can also be used. For instance, cell lines can be plated at 3×10³ cells/well in 0.4% agar, over a base layer of 0.6% agar. The test agent can then be added with growth media, and endpoints can be CTG or imaging assays. Figure 8 shows images comparing cisplatin dose response for both of these endpoints. The calculated EC50 values are comparable, which validated HCI as an endpoint for this assay.
Figure 8: Dose Response Curve for CFPAC-1 Cancer Cell Line Treated with Cisplatin Using CTG and HCI.
Ex Vivo Models in 3D Tumor Growth Assays (TGA) using Solid Tumor PDX Collection/Models PDX models and PDX-derived Cell Line Panels Cells
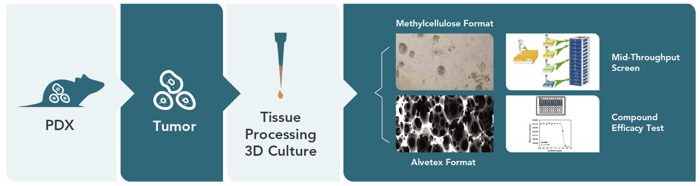
Figure 9: Depiction of how freshly isolated cells from highly-validated PDX models can be used for ex vivo clonogenic assays.
All PDX-derived ex vivo models can be utilized in this assay. For example, for freshly isolated primary cells inoculated in immunodeficient mice, xenografts are harvested, the tumor is lysed, and cells are seeded on methylcellulose or 3D Alvetex® plates to allow growth in 3D. Anticancer agents can then be tested and endpoints for evaluation can include phase contrast imaging and CTG to assess efficacy.
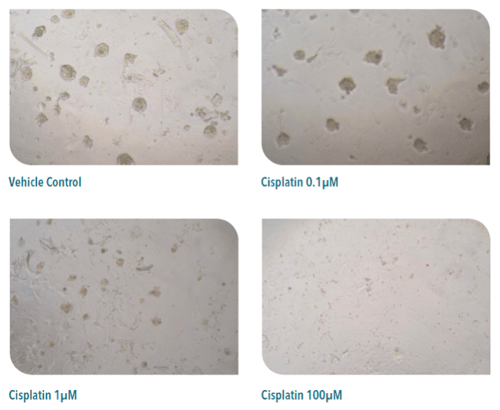
Below is an example of an ex vivo efficacy study conducted on freshly isolated primary cells from the gallbladder tumor model GL0440. Cisplatin was administered at different concentrations and images were taken for each dose.
Figure 10: Ex Vivo Efficacy Study of Cisplatin on Primary Cells Derived from GL0440 Grown in 3D.
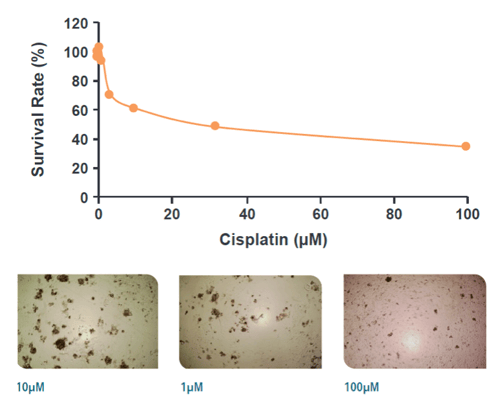
In another example, Figure 11 shows the dose response curve for cisplatin using freshly isolated cells from the OV5397 ovarian cancer PDX model in the methylcellulose assay.
Figure 11: Dose Response Curve for Cisplatin Effect on Primary Cells Derived from OV5397 Grown in 3D.
Moving Oncology Models Closer to the Clinic with the Ex Vivo Patient Tissue (EVPT) Platform
The Ex Vivo Patient Tissue (EVPT) platform allows researchers to evaluate anticancer drugs in patient tumors in the context of a preserved native tumor microenvironment (TME), including endogenous immune cells, fibroblasts, and other stromal components. By using 50-300 patient tumor tissues directly seeded in a 384-well format, the EVPT platform is a highly patient-relevant translational system that better recapitulates the heterogeneity and molecular/genetic complexity of human tumors. This allows for better decision-making when it comes to deciding whether to progress your oncology or immuno-oncology therapeutic candidates.
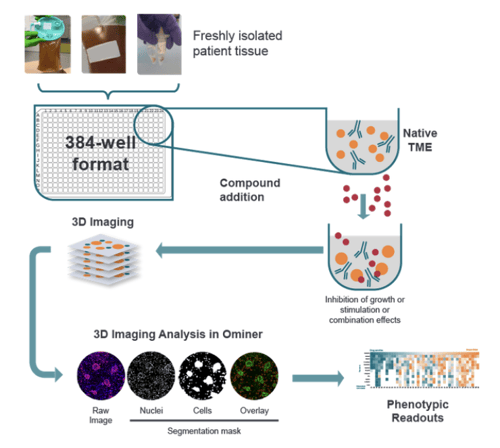
Drug effects, including tumor killing and immune cell proliferation, can be measured using automated 3D phenotypic HCI and HCA for robust evaluation of single and combination treatments in high throughput. Figure 12 depicts the assay principle. Additional analyses can also be conducted using flow cytometry, IHC, cytokine analysis, and next generation sequencing.
Figure 12: EVPT Assay Principle.
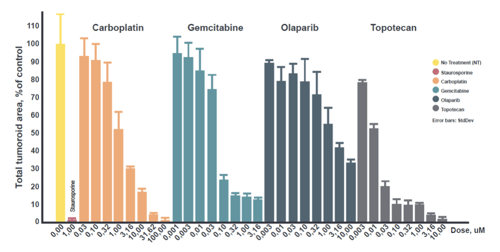
The following plot shows the concentration-dependent tumor killing response to various chemotherapeutic drugs using the EVPT platform (ovarian tumor tissue).
Figure 13: Testing Oncology Therapeutics at Various Doses using the EVPT Platform (Ovarian Tumor Tissue).
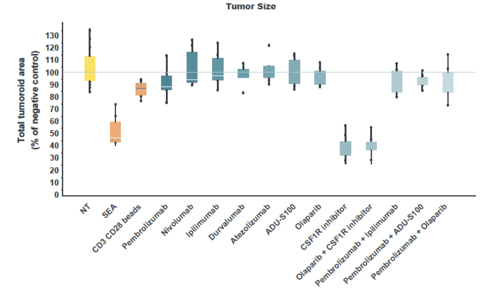
Figure 14 shows the results of a phenotypic readout for total tumor organoid area as a function of treatment with different immunotherapies regimens (single drugs and combinations).
Figure 14: Immunotherapy Responses with Phenotypic Readouts.
Conclusion
3D in vitro models, such as those described in this post, offer highly patient relevant models that are amenable to high-throughput drug screening for identifying effective dosing strategies. Because these 3D models more closely recapitulate the complex in vivo environment, they allow for better decision-making when it comes to developing dosing strategies, including single or multi-drug combinations. By pairing 3D in vitro studies with HCI and HCA, researchers can develop deep insights into a compound’s effects in vitro while closely mimicking an in vivo environment, ultimately allowing for more accurate predictions of in vivo drug responses.
Cite this Article
Vallerand, D., (2022) Developing Effective Dosing Strategies by Leveraging 3D In Vitro Models - Crown Bioscience. https://blog.crownbio.com/developing-effective-dosing-strategies-by-leveraging-3d-in-vitro-model
Imagine standing on the brink of a breakthrough in cancer treatment, only to be halted by one daunting barrier: drug resistance. In this episode of Cr…
Oncology drug approvals in H1 2025 In the first half of 2025, the FDA’s Center for Drug Evaluation and Research (CDER) approved a total of 16 novel dr…
Often referred to as “magic bullets” or “biological missiles”, antibody-drug conjugates (ADCs) are one of the most promising advances in targeted canc…