Visualize your agents in action and go beyond cell viability
In this post, we explore how high-content screening (HCS) can be used with 3D in vitro models to drive the discovery and development of novel oncology and immuno-oncology therapeutics.
What Is High-Content Screening?
As described in a previous post, HCS is a tool to collect detailed quantitative data from simple to complex cell populations, such as 3D spheroids, organoids, and even co-culture systems. High-throughput screening (HTS) typically delivers a single-end-point biochemical readout. By contrast, HCS allows for high-throughput phenotypic analysis at subcellular resolution using multicolored, fluorescence-based images. This multiparameter approach provides much deeper insight on the specificity and sensitivity of novel lead compounds to guide go/no-go decision-making before committing resources to labor-intensive and costly downstream in vivo studies.
Successfully implementing HCS requires integration with high-content imaging (HCI) and high-content analytical tools (HCA), such as multiparameter image processing and visualization tools. Combining these advanced tools, software, reagents, and bioinformatics pipelines means that large volumes of valuable data can be produced rapidly to provide immensely detailed views of cellular and drug interactions. These advances have led to HCS being increasingly adopted in oncology research, among many other disciplines, with applications spanning the drug discovery pipeline from hit identification to lead optimization.
Leveraging the Power of 3D Cell Culture Models
While HCI systems and analysis software have been available for roughly two decades, they have primarily been used for profiling layers that are single cell thick. However, increasing appreciation for how cellular heterogeneity and the microenvironment influences disease processes has led to efforts to develop HCI protocols for models that are more translatable 3D in vitro models.
Organoids and spheroids represent two of the most common types of 3D cell cultures. Organoids are an innovative advancement for in vitro drug screens. Optimized Hubrecht Organoid Technology (HUB) protocols can now reproducibly generate 3D in vitro organoids from both healthy and diseased tissue (e.g., tumors). They are easily scalable and highly clinically relevant, with greater predictivity for patient drug response than 2D cell cultures have. Compared to other advanced culture systems, 3D in vitro organoids are more robust and show enhanced reproducibility because they are very genetically and phenotypically stable (even after long-term culturing and cryopreservation) and have low batch-to-batch variation. In addition, their growth kinetics and performance are consistent across several passages, with scalable material available for repeat studies. These characteristics lead to higher-quality data that is reproducible, which is key to maximizing the chances of selecting drug candidates with better translatability and clinical success. Furthermore, organoids are amenable to all normal laboratory techniques, from traditional genetic engineering to more advanced gene editing approaches. Overall, HUB organoids enable researchers to make better decisions earlier in drug discovery and provide increased confidence that selected drug candidates will have better translatability.
Spheroids also better recapitulate the in vivo cellular environment compared to standard 2D monolayer cultures. However, unlike organoids, which are derived from a stem cell population within the originating tissue, spheroids form via aggregation. This results in structures that have less structural and physiological organ relevance. That drawback prevents them from being maintained in culture for extended periods. However, spheroids are easy to work with. When derived from tumor tissue, they result in “tumorspheres” which are enriched for cells with features of cancer stems cells (CSCs). This makes spheroids a good model for evaluating therapeutics targeting characteristics of this population, such as drug resistance.
Organoid Applications Using HCS, HCI, and HCA Approaches
High-Content Imaging and Analysis
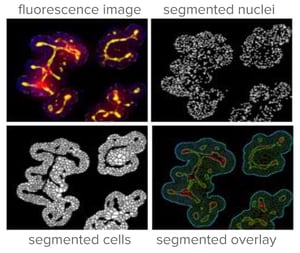
HCI enables spatial analysis to exploit more of the biological advantages and physiologically informative content provided by 3D in vitro models. For accurate image-based analysis, advanced image processing algorithms are needed that can extract data from individual organoids. Once these are optimized, the effect of test agents on parameters such as organoid size and shape can be measured.
Figure 1: Representative HCA images illustrating the accurate segmentation of individual 3D organoids and cellular layers from a raw multicolored fluorescent image.
HCI can also be used to discriminate compounds that induce cell cycle arrest, apoptosis, and necrosis. This an important advantage over standard biochemical viability assays, such as CellTiter-Glo (CTG). With HCI, the possibilities are endless. Available assays enable researchers to evaluate a wide variety of readouts, including tumor cell killing, target expression, antibody binding, and other morphological parameters, such as invasion and differentiation.
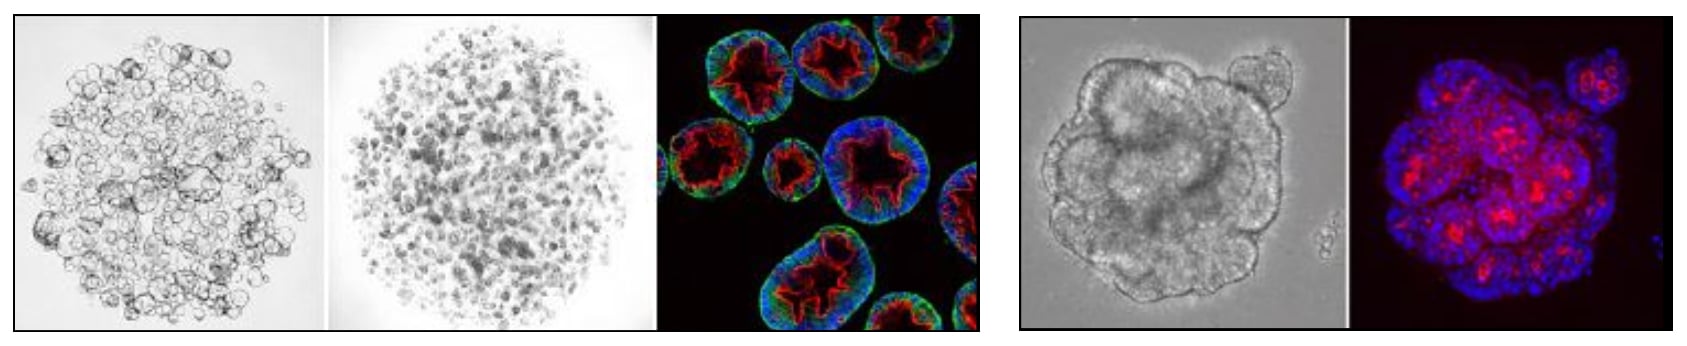
State-of-the-art HCI services and robust 3D in vitro imaging-based assays are now available. When combined with well-annotated biobanks of patient-derived xenograft organoids tumor models, patient-derived organoids, and 3D spheroids from CDX and patient-derived xenograft material, researchers now have a wide array of models that can provide the best opportunity to identify and optimize lead compounds with the highest clinical potential.
Figure 2. Representative HCA images of 3D patient-derived organoids (left) and patient-derived xenograft organoids (right).
HCI platforms can deliver phenotypic evaluation of response to treatment in scalable 384-well format and test single or multiple drug combination strategies simultaneously. With advanced 3D image analysis software, more than 500 phenotypic changes induced by new drugs can be accurately monitored and used to guide go/no-go decision-making on therapeutic candidates.
HCI-Based High-Throughput Drug Screening
HCI’s advantages can also be adapted to large-scale oncology drug screening with 3D in vitro models. HCI-based HTS can test single agents, compound libraries, dose ranges, and combinations. It is compatible with a variety of common and novel drug classes, including small molecules, peptides, proteins, antibodies, bispecifics, antibody drug conjugates, oncolytic viruses, and cell therapies. Therapeutic responses that can be measured include activity, toxicity, and synergy, with fast readouts of organoid growth/killing (comparable to CTG). The mode of action and off-target effects can also be evaluated to get a more complete picture of investigational agents.
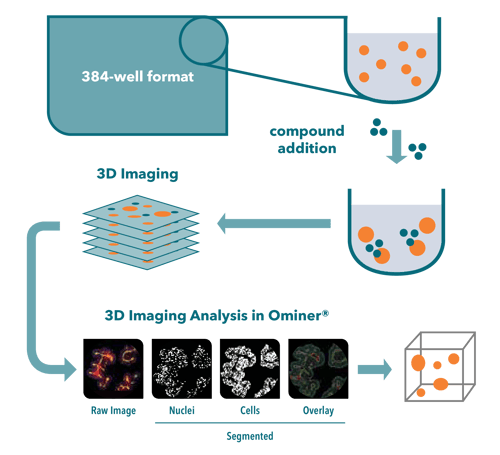
Figure 3. Overview of image-based high-throughput drug screening with organoids.
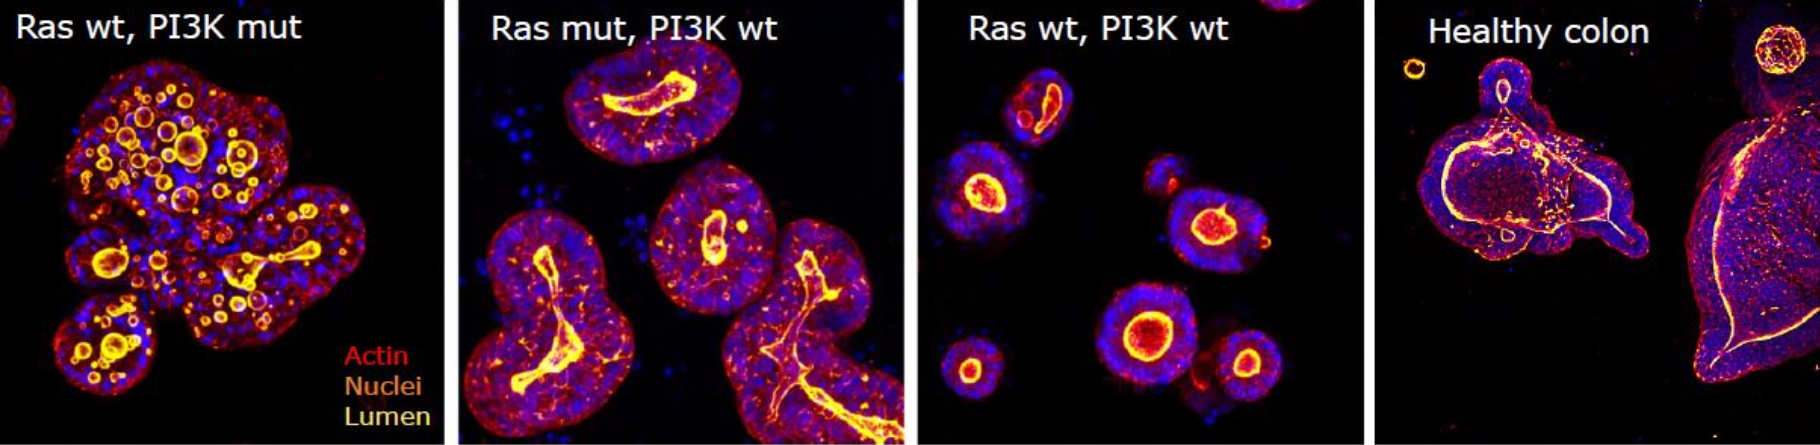
Figure 4. HCA images of patient-derived organoids illustrating diverse organoid morphologies related to variation in the presence of Ras and PI3K mutations.
Workflow of Imaged-Based HTS in Organoids
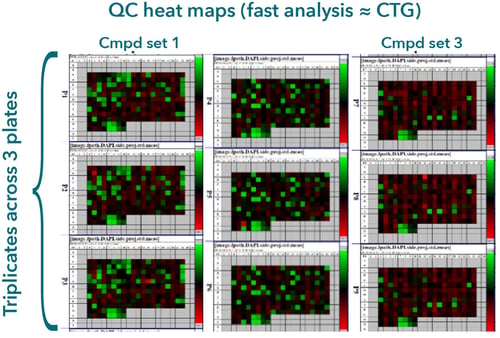
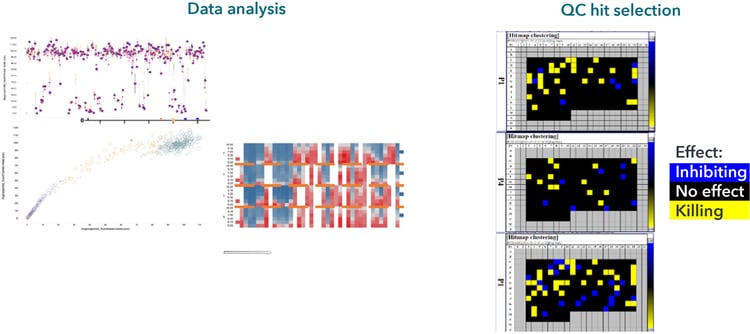
A typical HTS organoid screen workflow begins with a pilot screen run on high content, including an initial quality control (QC) step which can be useful for detecting any issues with the 3D culture conditions before embarking on a full-scale screen. Below are heatmaps of the fast readout, which provides an assessment of the fluorescent intensity signal and is roughly comparable to a general cell viability assay (CTG) readout (viable organoids = high intensity; dead organoids = low intensity).
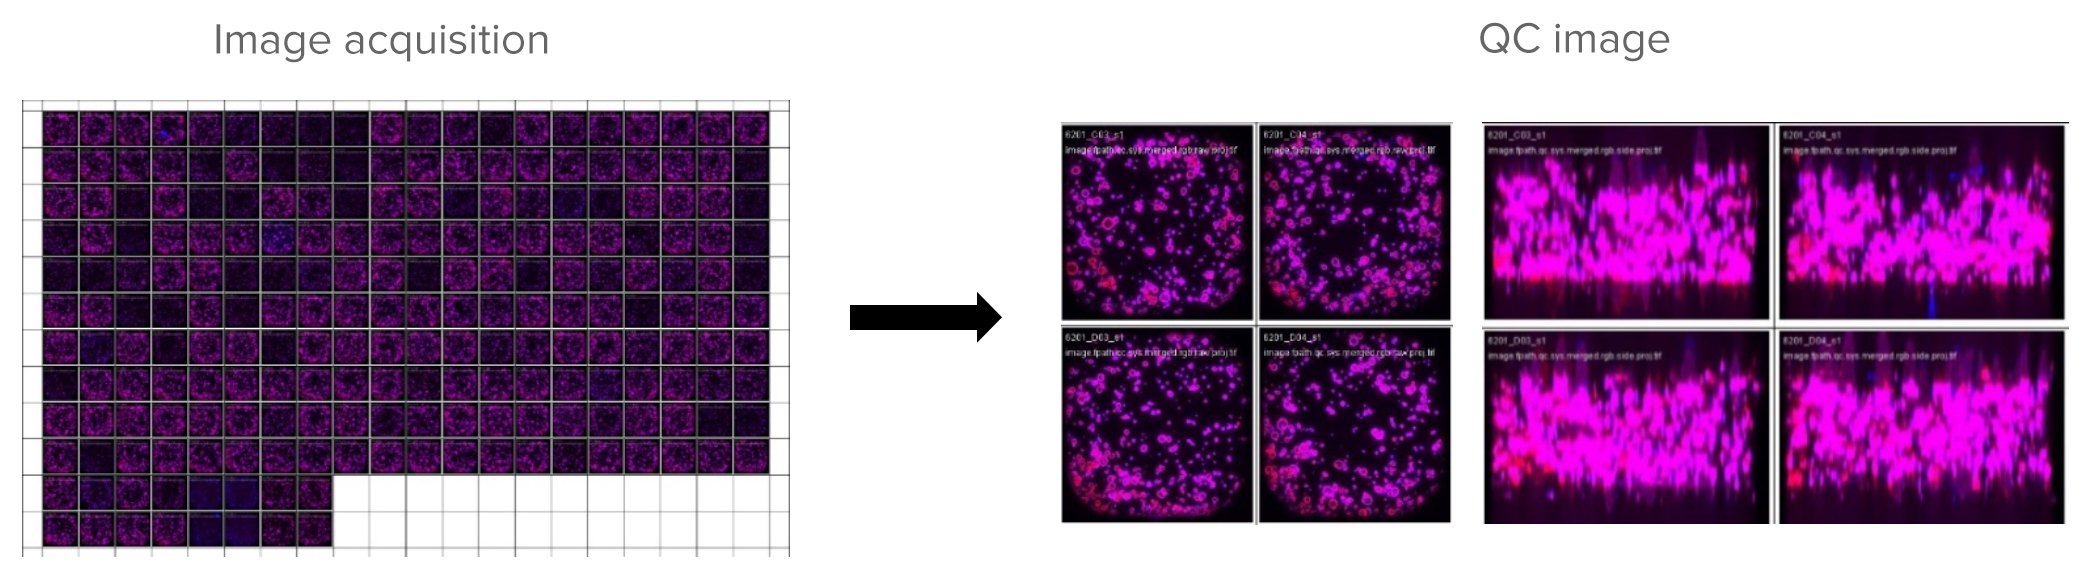
Next, the screen is initiated with cell seeding and compound addition. At the desired time point, 3D images of the fluorescently stained nuclei and actin cytoskeleton are acquired and analyzed per object to identify the cellular and organoid boundaries (segmentation). Image quality is part of the QC process together with the assessment of typical assay performance criteria.
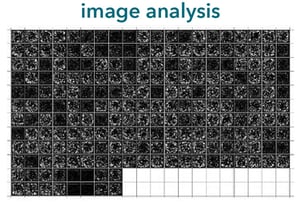
The 3D image analysis is then performed in Ominer®, a powerful software package that can extract multivariate data from each of the reconstituted images.
This rich dataset is then analyzed, and the phenotypic readouts are run through a suite of visualization tools that can be further mined for hit selection.
HCI-Based Immuno-Oncology Assays
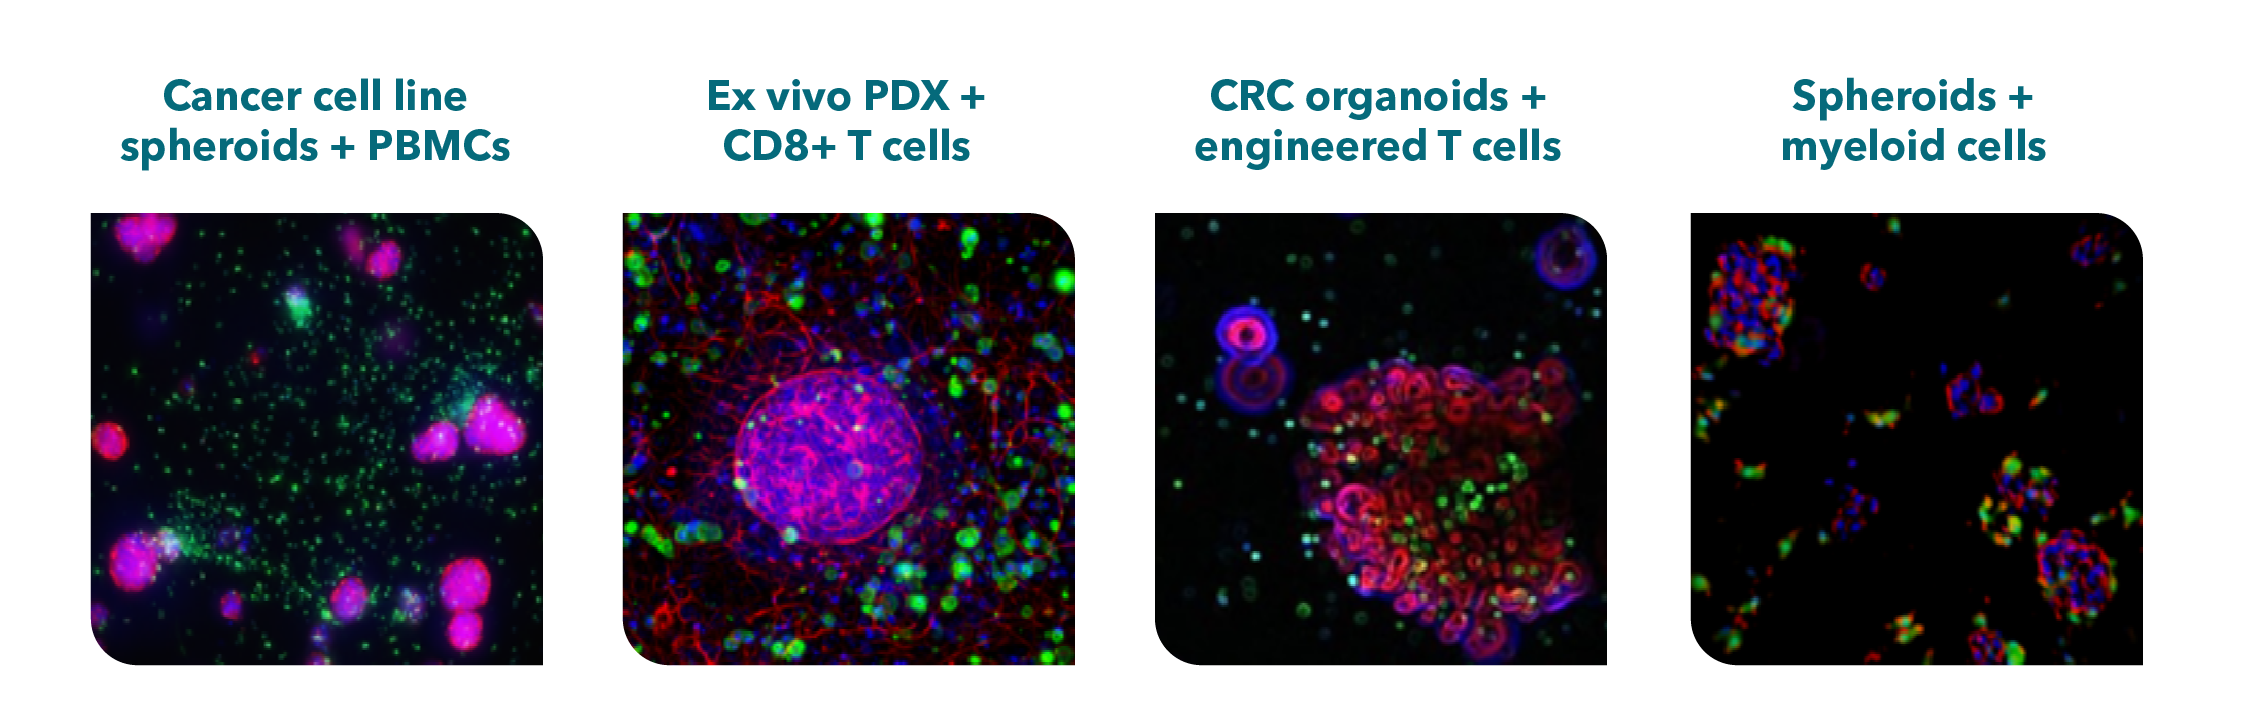
The success of immuno-oncology is a milestone in cancer treatment and has led to a wave of new investigational I/O agents. The use of 3D in vitro cell culture systems, specifically tumor-immune cell co-cultures, is emerging as an important method for evaluating I/O agents. These sophisticated assays are designed to mimic the tumor-immune microenvironment, determine the immunomodulatory properties of test compounds, and dissect the complex interactions between immune and tumor cell populations.
Figure 5. 3D Tumor models for evaluating immunotherapies.
I/O assays that can be combined with an HCI platform are available to evaluate a range of immunotherapies, including checkpoint inhibitors, vaccines, oncolytic viruses, cellular therapies, and bispecific T cell engagers. Readouts include immune cell priming, active migration, tumor infiltration, and tumor cell killing. HCI assays are also available that monitor the effect of immunotherapies on myeloid cells, a key immune cell population that promotes tumor progression and a proposed target for next-generation immunotherapies.
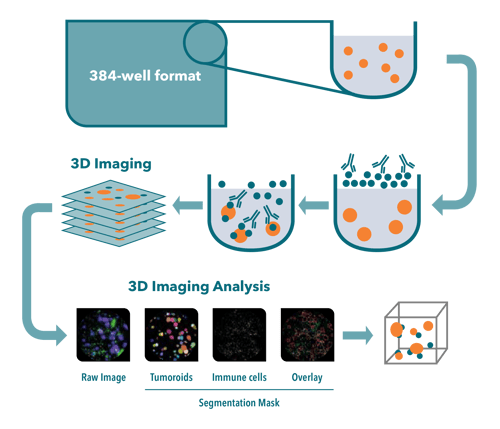
Figure 6. Overview of HCI-based I/O assays. TOP: Organoids are embedded in extracellular matrix in 384-well plates. Immune cells are stained and added on top of hydrogel. Test compounds are added simultaneously, before or after the immune component. Co-cultures are maintained for 1-7 days. Supernatants are collected before fixation/staining. After ‘optical sectioning’ 3D image stacks are reconstituted. Image analysis is performed to read out effects of drugs. BOTTOM: The goal of image processing is to extract individual organoid objects and individual immune cell objects, and to measure organoid phenotype (shape, size), immune cell count and relative positioning within organoids.
Conclusion
The 3D in vitro cell culture models that more accurately reflect the tumor microenvironment are now being widely adopted in drug discovery and development. When these are used in conjunction with high-content image analysis, lead identification and optimization can move beyond standard biochemical readouts to phenotypic-based changes, all within a more physiologically relevant system. Consult with our experts to find out more on how high-content image-based analysis can support your drug discovery efforts.
Cite this Article
Baillargeon, M., (2022) Next-Generation Lead Compound Identification and Optimization: Using High-Content Screening with 3D Organoids - Crown Bioscience. https://blog.crownbio.com/high-content-screening-for-lead-compound-identification-and-optimization
Imagine standing on the brink of a breakthrough in cancer treatment, only to be halted by one daunting barrier: drug resistance. In this episode of Cr…
Oncology drug approvals in H1 2025 In the first half of 2025, the FDA’s Center for Drug Evaluation and Research (CDER) approved a total of 16 novel dr…
Often referred to as “magic bullets” or “biological missiles”, antibody-drug conjugates (ADCs) are one of the most promising advances in targeted canc…