In this blog we explore how drug efficacy studies can incorporate highly comprehensive morphology readouts that extend beyond cell viability assessments by leveraging high content screening (HCS), high content imaging (HCI), and high content analysis (HCA).
Why Use High Content Screening for Drug Efficacy Screening Studies?
Most high-throughput drug screens are performed with 2D cell lines, such as Cancer Cell Panel Screening, which are valuable for providing quick results to inform early-stage decisions. Additionally, 3D in vitro models, such as tumor organoids, are increasingly being used as a result of optimized Hubrecht Organoid Technology (HUB) protocols that have been established to develop these 3D models from tumor tissue. Large and diverse collections (“biobanks”) of well-characterized organoids now capture patient population diversities that have been observed in large population studies.
Efficacy screens play an important role in identifying responder and non-responder tumor models from such biobanks. While traditional efficacy measures, such as half-maximal inhibitory concentration (IC50) defined by Cell-Titer Glo® (CTG) luminescent readouts for cell viability, high content services (HCS, HCI, HCA) are now more commonly being leveraged to produce highly comprehensive morphology readouts in both 2D and 3D models. The resulting high-quality and multifactorial data is actionable and can be used for downstream decision-making, such as determining which anticancer agents should be taken forward for further study.
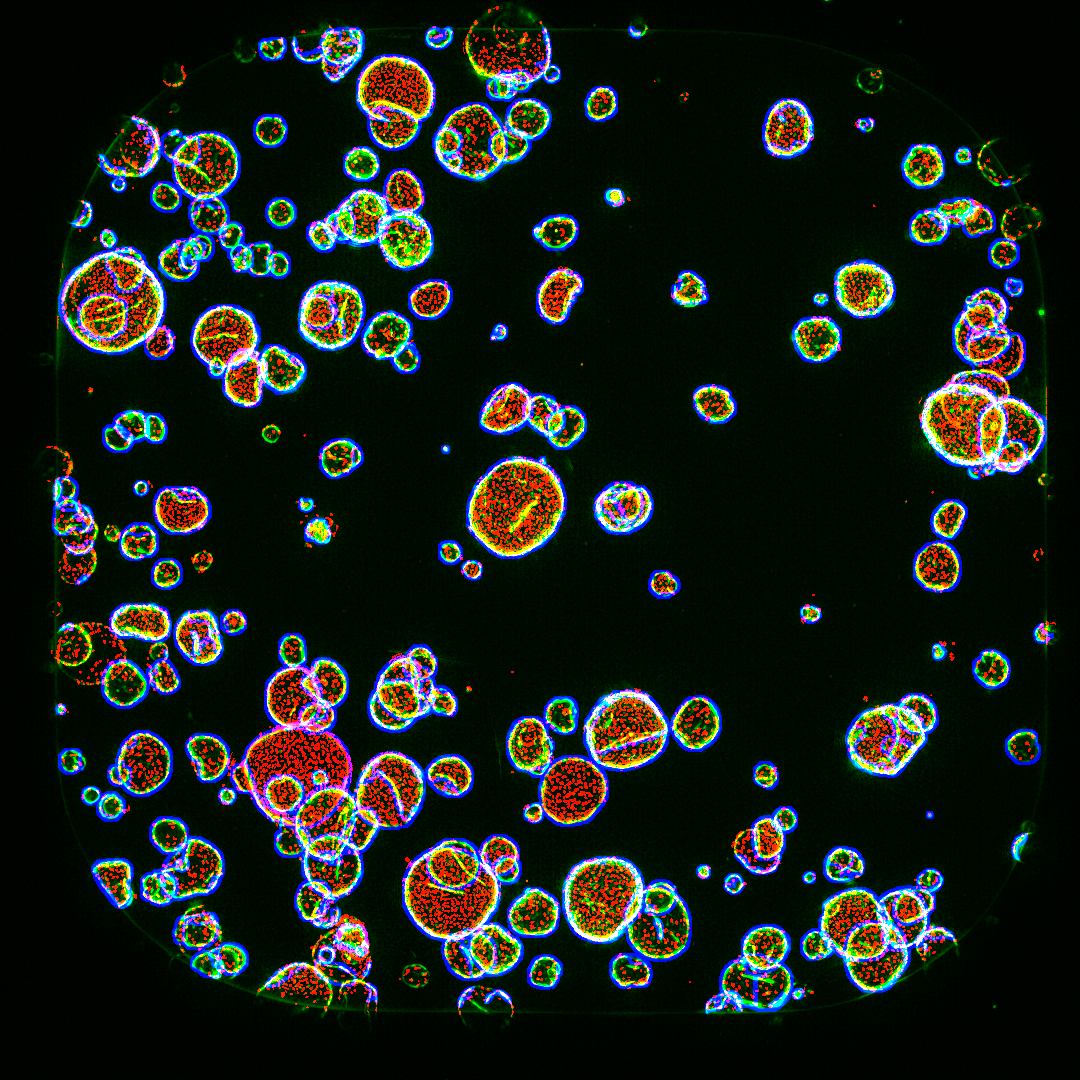
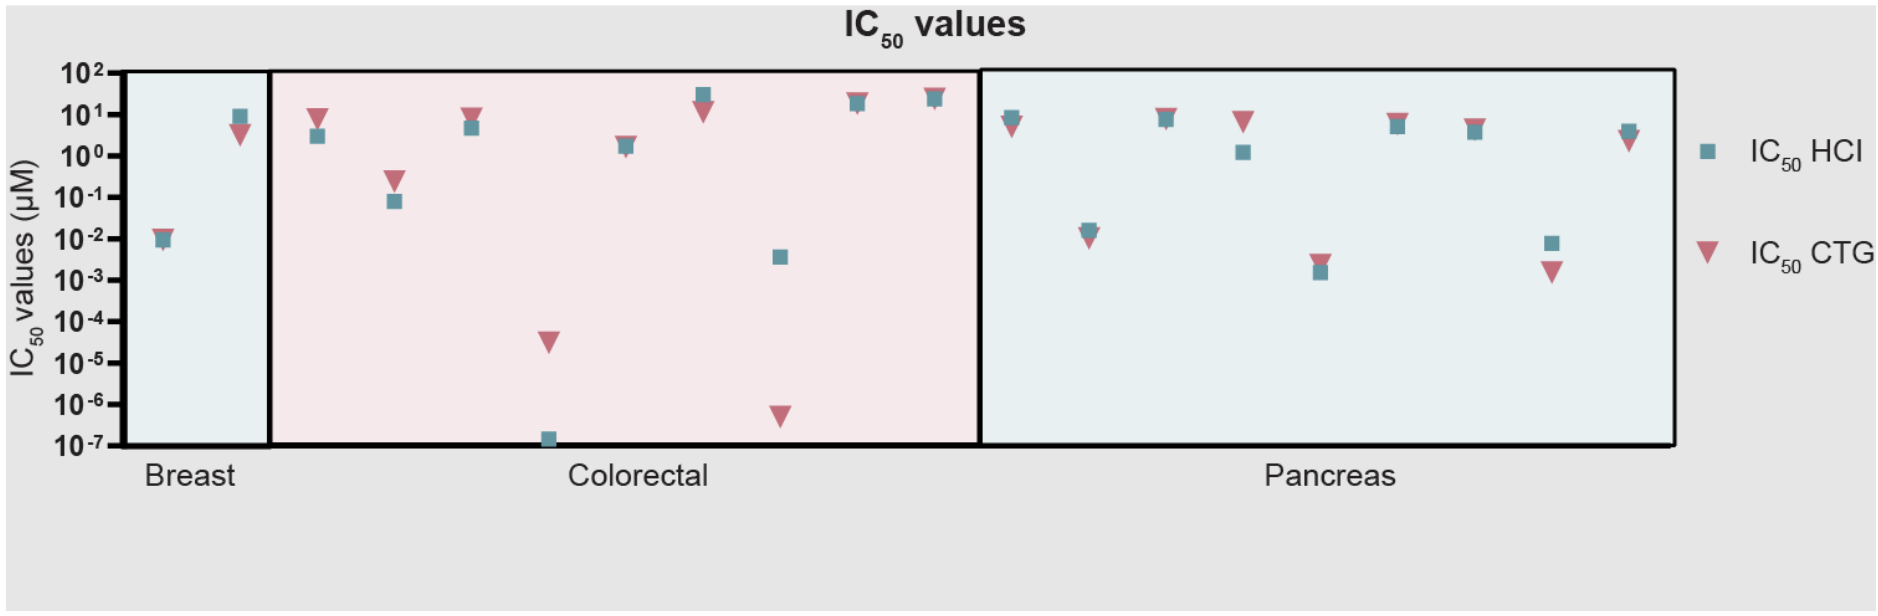
Figure 1 shows a comparison of CTG versus surviving nucleus count. Different breast, colon and pancreatic cancer organoid models were seeded in two parallel 384-well plates in 3D hydrogels and then exposed to 9-point compound dose ranges for 5 days. One plate was processed for CellTiterGlo viability assay. The parallel plate was fixed, stained with Hoechst and Phalloidin-Rhodamine, imaged, and 3D image stacks were collected by automated 3D microscopy. Nuclei were scored and labeled and were positive for F-actin, an indicator of viability.
Overall, the CTG data were observed to closely match the scoring of total number of surviving nuclei, indicating that HCI can generate similar results as CTG with regards to cell viability readouts.
However, as illustrated in the next sections, many additional molecular parameters/features data can simultaneously be evaluated from HCI morphological analysis—including, but not limited to, cell cycle status, cellular and nuclear size and morphology, receptor internalization, protein aggregation, epithelium formation and thickness, cell polarity—to better inform downstream go/no-go decisions.
Figure 1: Comparison of IC50 values calculated from CTG versus HCI. The total number of surviving DAPI-positive objects (Nuclei) within TRITC-positive objects (organoids) is correlating well with the CellTiterGlo signal.
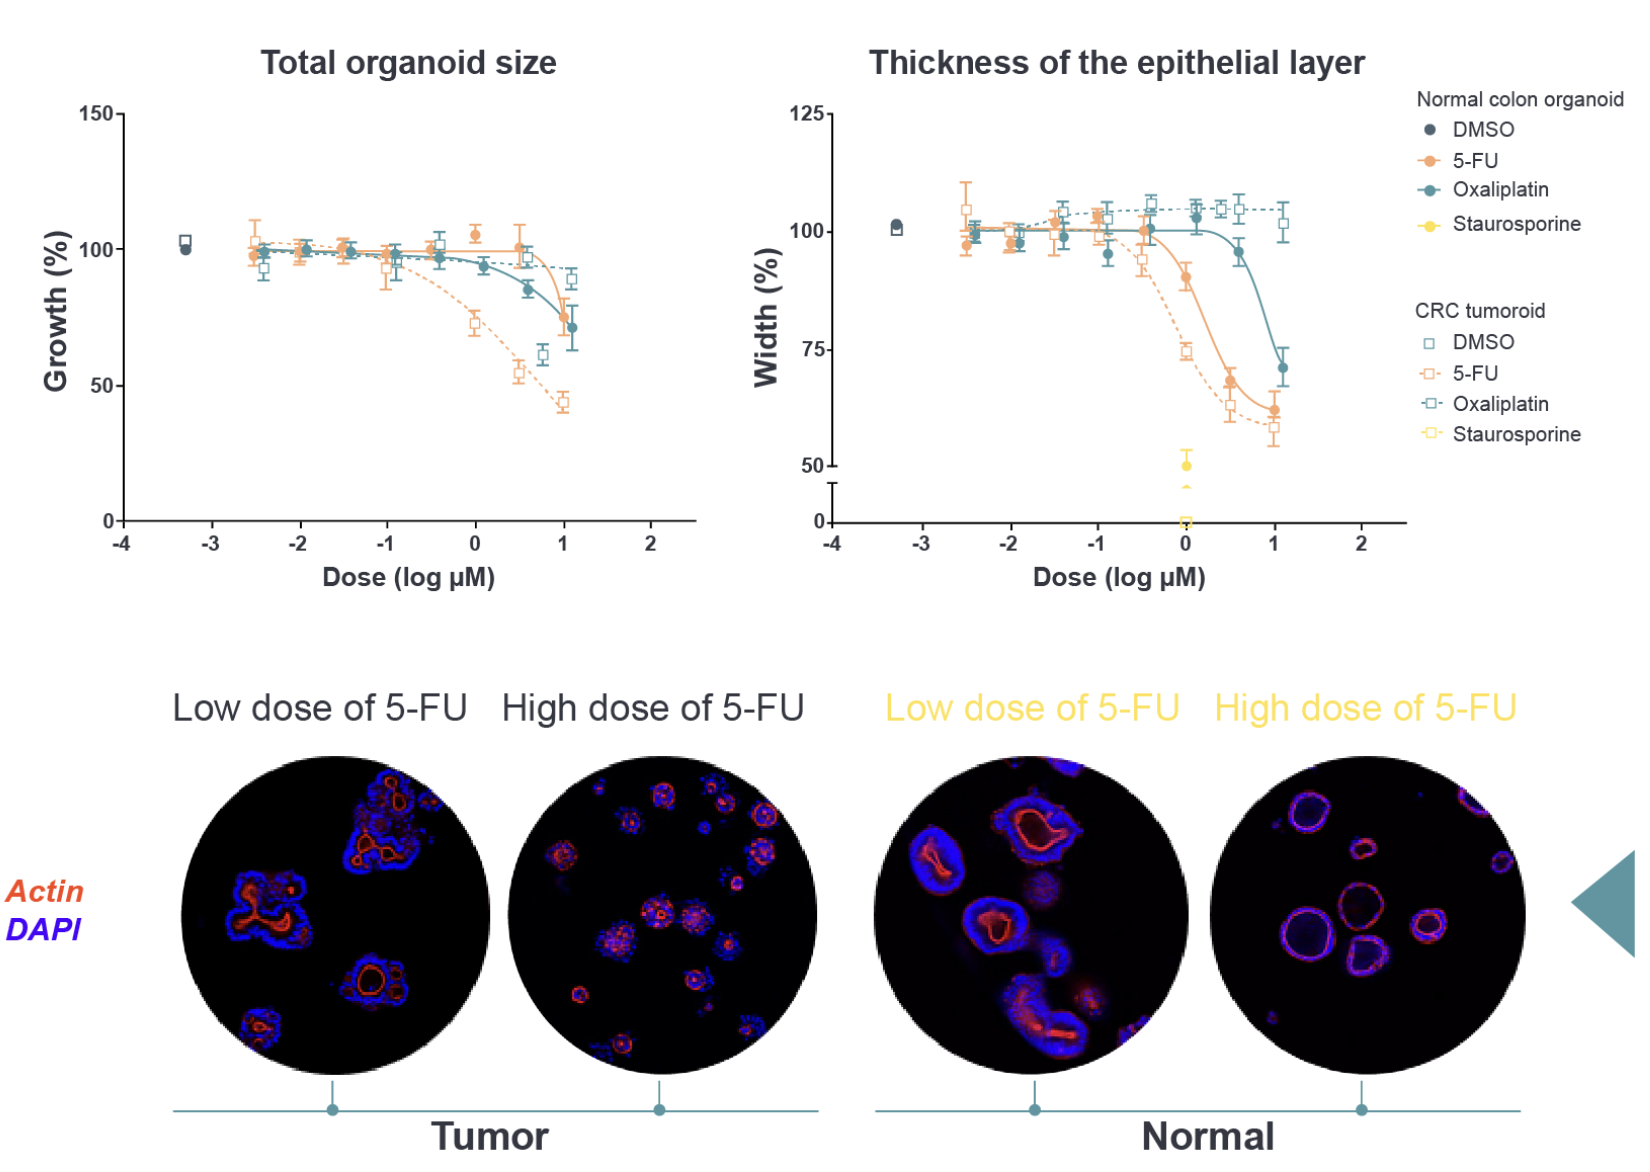
In the example below, Figure 2, normal colon organoids were compared with colorectal cancer (CRC) organoids. The CRC organoids reduced in size (top left graph) in response to the chemotherapy Fluorouracil (5-FU) treatment, but the normal colon organoids from the same patient continued to survive the treatment.
Additional morphological analysis, however, revealed that the thickness of epithelial layer (top right graph) is affected when the healthy colon organoids are exposed to 5-FU: the epithelium had become thinner (bottom images: actin is red and DAPI is blue). This is consistent with the gastrointestinal-related adverse effects that are commonly induced by 5-FU.
Figure 2: Morphology-based imaging can provide information on the following: Effects on tumor growth, effects that weaken or disrupt without killing (toxicity window), and effects on normal cells.
HCA and phenotypic profiling can also be used to discriminate and classify different compounds based on mechanisms of action. This is because when compounds disrupt different signaling pathways, they have differing effects on morphology. This strategy was used to discriminate inhibition of different growth factor receptors by bispecific antibodies, resulting in the identification of a bispecific antibody (known as MCLA-158) that targets EGFR and the stem cell marker, LGR5 (Herpers 2022). This antibody has now advanced into human clinical trials.
Just like traditional screening studies, drug response using image-mediated morphology profiling is assessed after treating cells with multiple concentrations of compounds. However, instead of using a cell viability assay, such as CTG, image-based “Fast Screen” readouts are obtained. This type of output takes advantage of automation advances that have made them very efficient and able to provide highly comprehensive phenotypic readouts that go beyond cell viability.
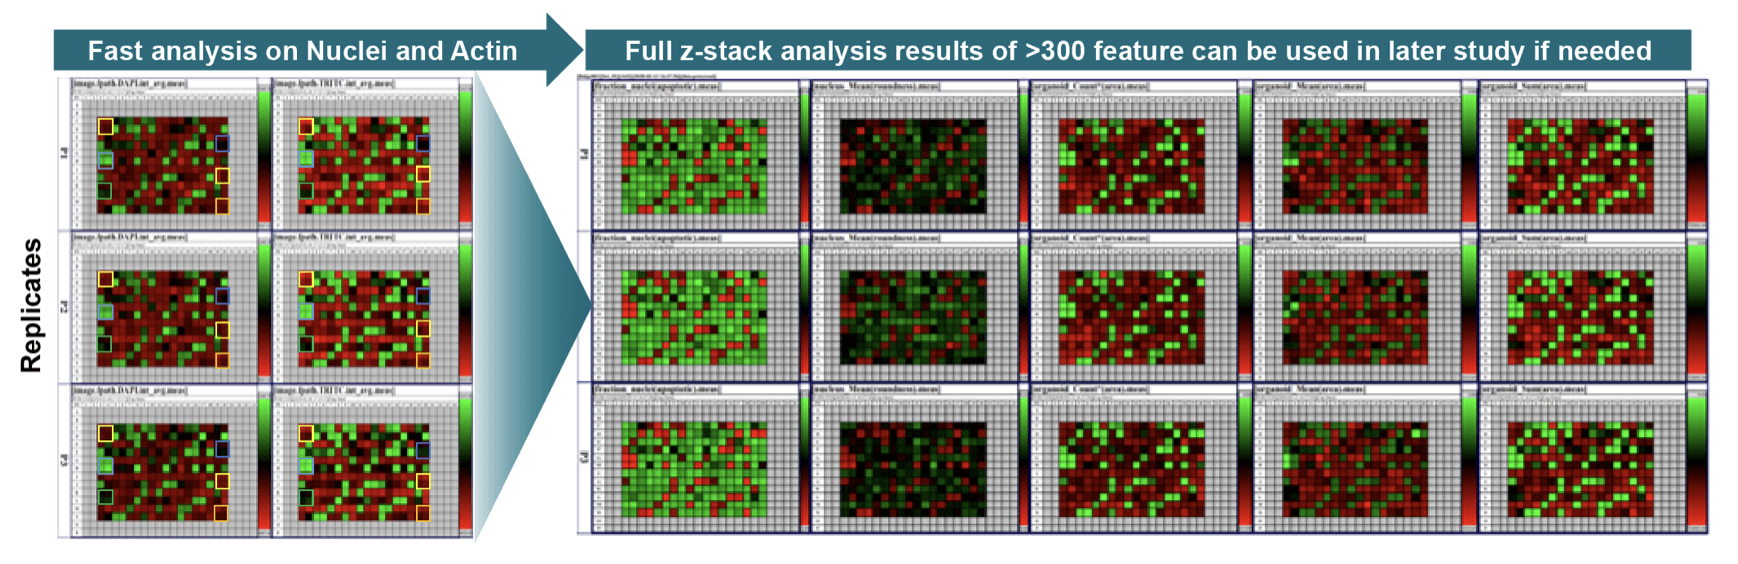
Modern “Fast Screens” are phenotypic screens conducted in a single plate and relying on analytics to pick samples with the most observable changes. Fast analysis is performed on the images and measures the raw intensity of the images in all captured channels (standard DAPI and TRITC for staining nuclei and Actin, respectively). While the fast analysis can be enough to assess the killing effects of the compound treatments, without the need to run full image analysis, but if needed the full analysis can be conducted for a highly in-depth analysis which is not possible using CTG.
Furthermore, since fast analysis does not require image analysis or much time from the bioinformatics team, the total assay cost is 25% lower than full image analysis. This approach advances experiments quickly because the data are comprehensive and often forestall additional intermediary/follow-on studies.
Figure 3: Example of a Representative “Fast” Image Based Viability Analysis. (Left) Fast analysis on nuclei and actin, and (Right) Full z-stack analysis resulting in more than 300 morphological assays in a single assay.
As described in a previous post, HCI platforms can deliver phenotypic evaluations of response to treatment in scalable 384-well format, where single or multiple drug combination strategies can be tested at the same time. Leveraging advanced 3D image analysis software allows for capturing and considering more than 500 phenotypic changes (e.g., tumor and nucleus count, size, volume, shape; epithelium formation and thickness; necrosis/apoptosis markers; polarity; swelling) to inform downstream go/no-go decisions.
Automated High Content Screening Platform and Analysis
The aim of high content screening (HCS) is analogous to other traditional high-throughput screening (HTS) methods that screen hundreds to millions of compounds, with the objective of identifying new drug targets and hits, or target and lead optimization in complex cellular systems.
HCS is commonly considered to be more predictive than traditional plate-reader-based HTS, since the HCI employed in HCS screening can monitor multiple highly detailed phenotypic endpoints that are associated with on-target and/or off-target effects. As described above, advances in automated processes have greatly improved HCI efficiencies and turnaround time, allowing large screens to be executed efficiently.
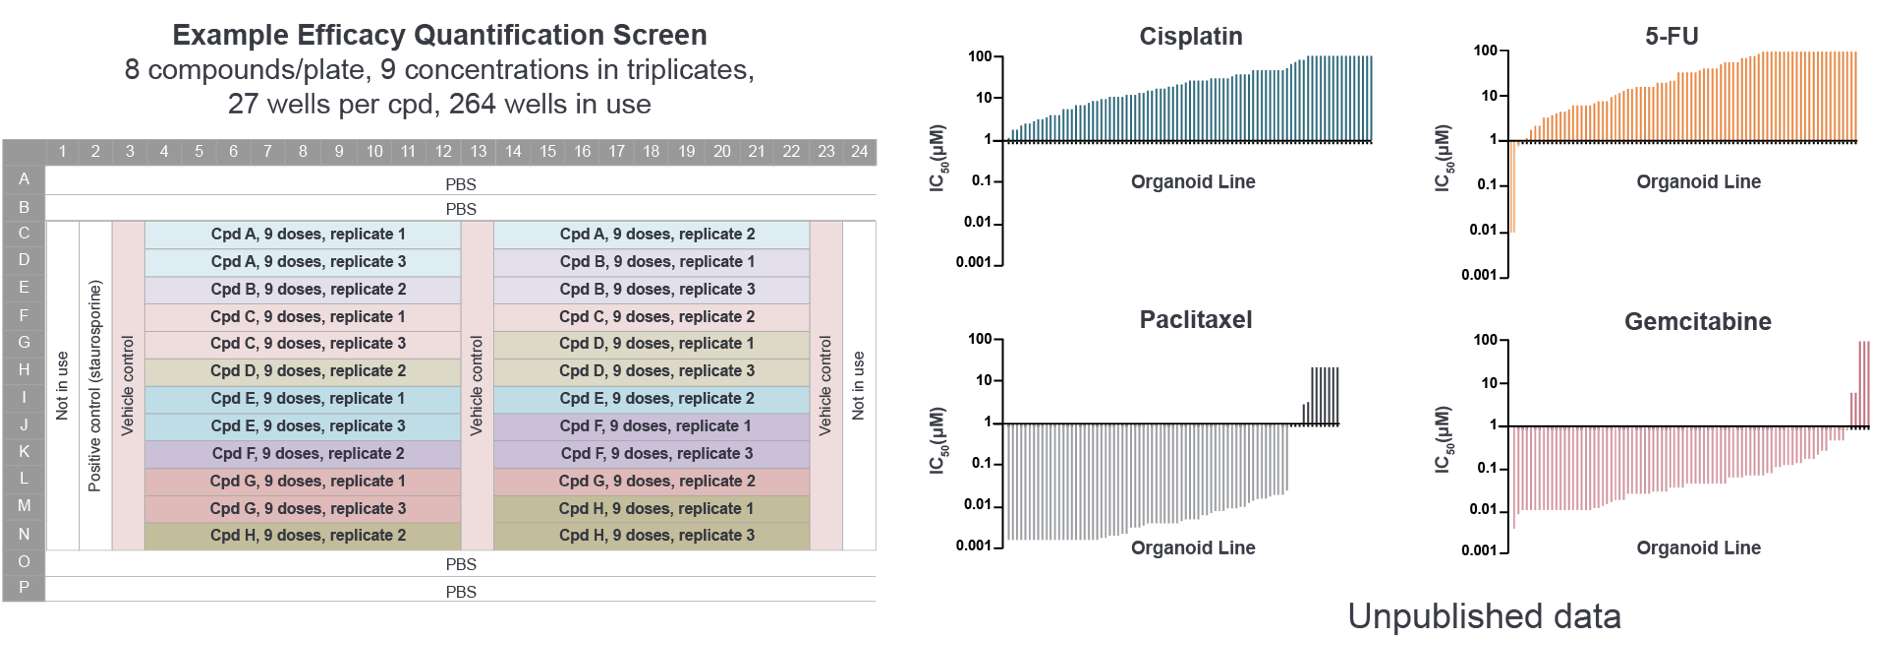
An example efficacy quantification screening output is shown below. Efficacy can be quantified across patients and compounds and for predicting in vivo response using a standard IC50 assay design which can be used to identify responders/non-responders and predictive biomarkers.
Figure 4: Data Efficacy Quantification Screen. Staurosporine positive control, Z′ factor and brightfield microscopy included in screening.
Conclusion
Imaged-based high-throughput technologies such as HCS are enabling us to move beyond cell viability assessments for quantifying drug efficacy. These assessments are more predictive for in vivo effects and they allow for better-informed downstream decisions, such as selecting the most appropriate cancer indications, guiding which agents to move forward, and identifying the best combination regimens. These assays allow us to improve the odds of developing and delivering a successful anticancer agent at the right time.
Cite this Article
Baillargeon, M., (2022) Using High Content Screening to Move Beyond Cell Viability Assessments for Quantifying Drug Efficacy - Crown Bioscience. https://blog.crownbio.com/using-high-content-screening-to-move-beyond-cell-viability-assessments-for-quantifying-drug-efficacy
Imagine standing on the brink of a breakthrough in cancer treatment, only to be halted by one daunting barrier: drug resistance. In this episode of Cr…
Oncology drug approvals in H1 2025 In the first half of 2025, the FDA’s Center for Drug Evaluation and Research (CDER) approved a total of 16 novel dr…
Often referred to as “magic bullets” or “biological missiles”, antibody-drug conjugates (ADCs) are one of the most promising advances in targeted canc…